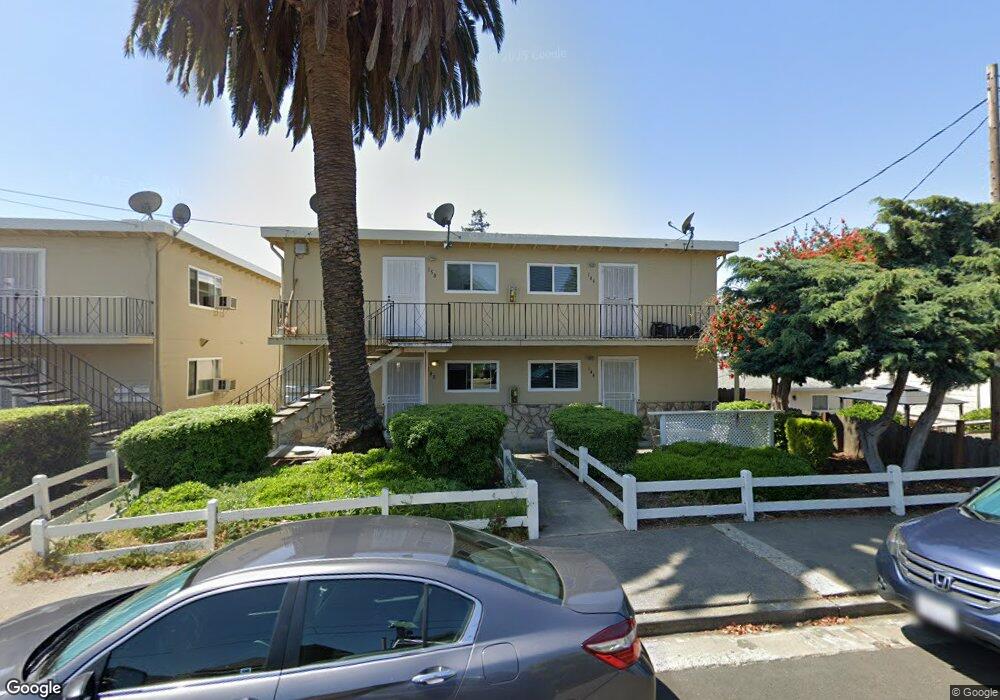
150 E I St Benicia, CA 94510
Estimated Value: $789,210 - $1,132,000
2
Beds
1
Bath
1,929
Sq Ft
$458/Sq Ft
Est. Value
About This Home
This home is located at 150 E I St, Benicia, CA 94510 and is currently estimated at $882,553, approximately $457 per square foot. 150 E I St is a home located in Solano County with nearby schools including Mary Farmar Elementary School, Benicia Middle School, and Benicia High School.
Ownership History
Date
Name
Owned For
Owner Type
Purchase Details
Closed on
Jan 23, 2015
Sold by
Klein Christopher M and Klein Kimberly A
Bought by
Klein 2015 Li Christopher M and Klein 2015 Li Kimberly A
Current Estimated Value
Purchase Details
Closed on
Nov 6, 1997
Sold by
Olson Michael J and Olson Elizabeth
Bought by
Klein Christopher M and Klein Kimberly A
Home Financials for this Owner
Home Financials are based on the most recent Mortgage that was taken out on this home.
Original Mortgage
$185,000
Outstanding Balance
$30,227
Interest Rate
7.23%
Estimated Equity
$852,326
Create a Home Valuation Report for This Property
The Home Valuation Report is an in-depth analysis detailing your home's value as well as a comparison with similar homes in the area
Home Values in the Area
Average Home Value in this Area
Purchase History
| Date | Buyer | Sale Price | Title Company |
|---|---|---|---|
| Klein 2015 Li Christopher M | -- | None Available | |
| Klein Christopher M | -- | None Available | |
| Klein Christopher M | $367,000 | Chicago Title Co |
Source: Public Records
Mortgage History
| Date | Status | Borrower | Loan Amount |
|---|---|---|---|
| Open | Klein Christopher M | $185,000 |
Source: Public Records
Tax History
| Year | Tax Paid | Tax Assessment Tax Assessment Total Assessment is a certain percentage of the fair market value that is determined by local assessors to be the total taxable value of land and additions on the property. | Land | Improvement |
|---|---|---|---|---|
| 2025 | $6,787 | $586,006 | $159,672 | $426,334 |
| 2024 | $6,787 | $574,517 | $156,542 | $417,975 |
| 2023 | $6,622 | $563,253 | $153,473 | $409,780 |
| 2022 | $6,497 | $552,210 | $150,464 | $401,746 |
| 2021 | $6,363 | $541,383 | $147,514 | $393,869 |
| 2020 | $6,278 | $535,833 | $146,002 | $389,831 |
| 2019 | $6,167 | $525,328 | $143,140 | $382,188 |
| 2018 | $6,008 | $515,029 | $140,334 | $374,695 |
| 2017 | $5,868 | $504,932 | $137,583 | $367,349 |
| 2016 | $5,917 | $495,033 | $134,886 | $360,147 |
| 2015 | $5,766 | $487,598 | $132,860 | $354,738 |
| 2014 | $5,696 | $478,048 | $130,258 | $347,790 |
Source: Public Records
Map
Nearby Homes
Your Personal Tour Guide
Ask me questions while you tour the home.