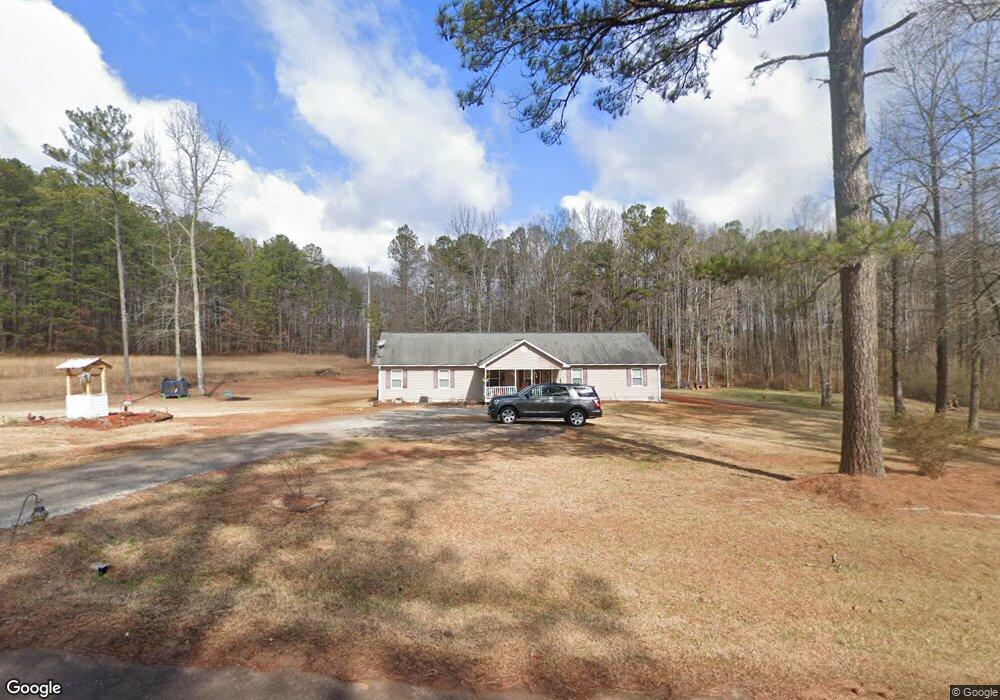
150 E Ranchette Rd Temple, GA 30179
Estimated Value: $296,043 - $330,000
3
Beds
3
Baths
2,128
Sq Ft
$147/Sq Ft
Est. Value
About This Home
This home is located at 150 E Ranchette Rd, Temple, GA 30179 and is currently estimated at $313,761, approximately $147 per square foot. 150 E Ranchette Rd is a home located in Carroll County with nearby schools including Providence Elementary School, Temple Middle School, and Temple High School.
Ownership History
Date
Name
Owned For
Owner Type
Purchase Details
Closed on
Aug 15, 2018
Sold by
Evans Derwin C
Bought by
Evans Eddie D
Current Estimated Value
Home Financials for this Owner
Home Financials are based on the most recent Mortgage that was taken out on this home.
Original Mortgage
$112,000
Outstanding Balance
$96,861
Interest Rate
4.5%
Mortgage Type
New Conventional
Estimated Equity
$216,900
Purchase Details
Closed on
Dec 23, 2010
Sold by
Cochran Custom Homes Inc
Bought by
Evans Derwin C
Home Financials for this Owner
Home Financials are based on the most recent Mortgage that was taken out on this home.
Original Mortgage
$109,606
Interest Rate
4.4%
Mortgage Type
New Conventional
Purchase Details
Closed on
Oct 5, 2010
Sold by
Evans Eddie
Bought by
Cochran Custom Homes Inc
Purchase Details
Closed on
Dec 5, 2003
Sold by
Rose Carolyn Nka Carolyn Evans
Bought by
Evans Carolyn and Evans Eddie
Create a Home Valuation Report for This Property
The Home Valuation Report is an in-depth analysis detailing your home's value as well as a comparison with similar homes in the area
Home Values in the Area
Average Home Value in this Area
Purchase History
| Date | Buyer | Sale Price | Title Company |
|---|---|---|---|
| Evans Eddie D | $140,000 | -- | |
| Evans Derwin C | $100,000 | -- | |
| Cochran Custom Homes Inc | $43,370 | -- | |
| Evans Carolyn | -- | -- |
Source: Public Records
Mortgage History
| Date | Status | Borrower | Loan Amount |
|---|---|---|---|
| Open | Evans Eddie D | $112,000 | |
| Previous Owner | Cochran Custom Homes Inc | $109,606 |
Source: Public Records
Tax History
| Year | Tax Paid | Tax Assessment Tax Assessment Total Assessment is a certain percentage of the fair market value that is determined by local assessors to be the total taxable value of land and additions on the property. | Land | Improvement |
|---|---|---|---|---|
| 2025 | $616 | $117,342 | $7,720 | $109,622 |
| 2024 | $623 | $117,342 | $7,720 | $109,622 |
| 2023 | $623 | $105,871 | $6,176 | $99,695 |
| 2022 | $2,108 | $84,059 | $4,118 | $79,941 |
| 2021 | $1,841 | $71,814 | $3,294 | $68,520 |
| 2020 | $1,622 | $63,184 | $2,994 | $60,190 |
| 2019 | $1,449 | $56,944 | $2,994 | $53,950 |
| 2018 | $1,271 | $48,422 | $2,799 | $45,623 |
| 2017 | $1,275 | $48,422 | $2,799 | $45,623 |
| 2016 | $1,276 | $48,422 | $2,799 | $45,623 |
| 2015 | $1,228 | $43,907 | $3,825 | $40,083 |
| 2014 | $1,233 | $43,908 | $3,825 | $40,083 |
Source: Public Records
Map
Nearby Homes
- 101 Robindale Ln
- 133 Greentree Trail
- 133 Pebblebrook Way
- 139 Clover Ct
- 100 Gordons Lake Dr
- 147 Camp Godwin Rd
- 223 Sunlight Cove
- 180 Labelle Rd
- 118 Raven Rd
- 0 Old Draketown Trail (5 62 Ac) Unit 293
- 21 + - Acres On Allgood Church Rd
- 0 Old Draketown Trail (5 62 Ac) Unit 10711831
- 122 Wesley Chapel Ln
- 18 Holder Rd
- 105 Chrissy Dr
- 415 Old Draketown Trail
- 1021 Cown Rd
- 0 Old Draketown Trail Unit 10668385
- 0 Old Draketown Trail Unit 7700911
- 102 Pine Bark Dr
- 168 E Ranchette Rd
- 138 E Ranchette Rd
- 180 E Ranchette Rd
- 139 E Ranchette Rd
- 177 E Ranchette Rd
- 99 E Ranchette Rd
- 76 E Ranchette Rd
- E E Ranchette Rd
- E E Ranchette Rd Unit 10
- 1407 Taylors Gin Rd
- 65 E Ranchette Rd
- 51 Ryder Rd
- 1367 Taylors Gin Rd
- 30 E Ranchette Rd
- 1327 Taylors Gin Rd
- 36 Ryder Rd
- 1309 Taylors Gin Rd
- 17 E Ranchette Rd
- 10 E Ranchette Rd
- 76 Ryder Rd
Your Personal Tour Guide
Ask me questions while you tour the home.