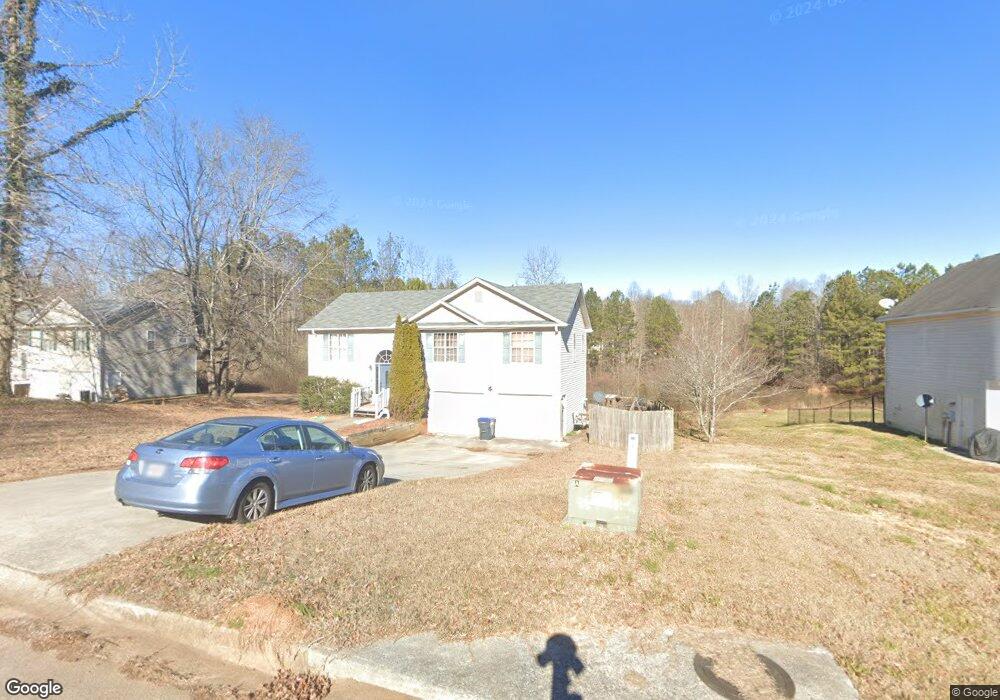
150 Edward Dr Temple, GA 30179
Estimated Value: $245,000 - $268,000
4
Beds
2
Baths
1,170
Sq Ft
$216/Sq Ft
Est. Value
About This Home
This home is located at 150 Edward Dr, Temple, GA 30179 and is currently estimated at $253,260, approximately $216 per square foot. 150 Edward Dr is a home located in Carroll County with nearby schools including Providence Elementary School, Temple Middle School, and Temple High School.
Ownership History
Date
Name
Owned For
Owner Type
Purchase Details
Closed on
Mar 4, 2016
Sold by
Harlan Meghan
Bought by
Moore Sara and Mccleary Bruce
Current Estimated Value
Home Financials for this Owner
Home Financials are based on the most recent Mortgage that was taken out on this home.
Original Mortgage
$89,351
Outstanding Balance
$70,306
Interest Rate
3.72%
Mortgage Type
FHA
Estimated Equity
$182,954
Purchase Details
Closed on
Feb 4, 2011
Sold by
Tidwell Cynthia P
Bought by
Harlan Meghan E
Purchase Details
Closed on
Mar 31, 2008
Sold by
Wiley Leon E
Bought by
Tidwell Cynthia P
Home Financials for this Owner
Home Financials are based on the most recent Mortgage that was taken out on this home.
Original Mortgage
$81,600
Interest Rate
6.22%
Mortgage Type
New Conventional
Purchase Details
Closed on
Oct 19, 2001
Sold by
Ranco Const Co
Bought by
Wiley Leon E
Purchase Details
Closed on
Jun 5, 2001
Sold by
Cole Bldrs
Bought by
Ranco Const Co
Create a Home Valuation Report for This Property
The Home Valuation Report is an in-depth analysis detailing your home's value as well as a comparison with similar homes in the area
Home Values in the Area
Average Home Value in this Area
Purchase History
| Date | Buyer | Sale Price | Title Company |
|---|---|---|---|
| Moore Sara | $91,000 | -- | |
| Harlan Meghan E | -- | -- | |
| Harlan Meghan E | -- | -- | |
| Tidwell Cynthia P | $102,000 | -- | |
| Wiley Leon E | $94,600 | -- | |
| Ranco Const Co | $14,000 | -- |
Source: Public Records
Mortgage History
| Date | Status | Borrower | Loan Amount |
|---|---|---|---|
| Open | Moore Sara | $89,351 | |
| Previous Owner | Tidwell Cynthia P | $81,600 |
Source: Public Records
Tax History
| Year | Tax Paid | Tax Assessment Tax Assessment Total Assessment is a certain percentage of the fair market value that is determined by local assessors to be the total taxable value of land and additions on the property. | Land | Improvement |
|---|---|---|---|---|
| 2025 | $2,161 | $96,611 | $8,000 | $88,611 |
| 2024 | $2,186 | $96,611 | $8,000 | $88,611 |
| 2023 | $2,186 | $89,179 | $8,000 | $81,179 |
| 2022 | $1,833 | $73,103 | $8,000 | $65,103 |
| 2021 | $1,406 | $54,857 | $8,000 | $46,857 |
| 2020 | $1,288 | $50,168 | $8,000 | $42,168 |
| 2019 | $1,208 | $46,692 | $8,000 | $38,692 |
| 2018 | $1,109 | $42,244 | $8,000 | $34,244 |
| 2017 | $959 | $42,280 | $10,000 | $32,280 |
| 2016 | $1,114 | $42,280 | $10,000 | $32,280 |
| 2015 | $921 | $32,936 | $8,000 | $24,937 |
| 2014 | $925 | $32,937 | $8,000 | $24,937 |
Source: Public Records
Map
Nearby Homes
- 223 Sunlight Cove
- 100 Gordons Lake Dr
- 0 Old Draketown Trail Unit 10668385
- 0 Old Draketown Trail Unit 7700911
- 489 Bethany Woods Dr
- 410 Nottely Dr
- 411 Nottely Dr
- 329 Morgan Rd
- 40 Holder Rd
- 125 Meadowview Dr Unit 14
- 115 Meadowview Dr Unit 19
- 119 Meadowview Dr Unit 17
- 121 Meadowview Dr Unit 16
- 117 Meadowview Dr Unit 18
- 123 Meadowview Dr Unit 15
- 150 Charles Painter Rd
- 412 Megan Place
- 169 Rachel Blvd
- 139 Clover Ct
- 133 Pebblebrook Way