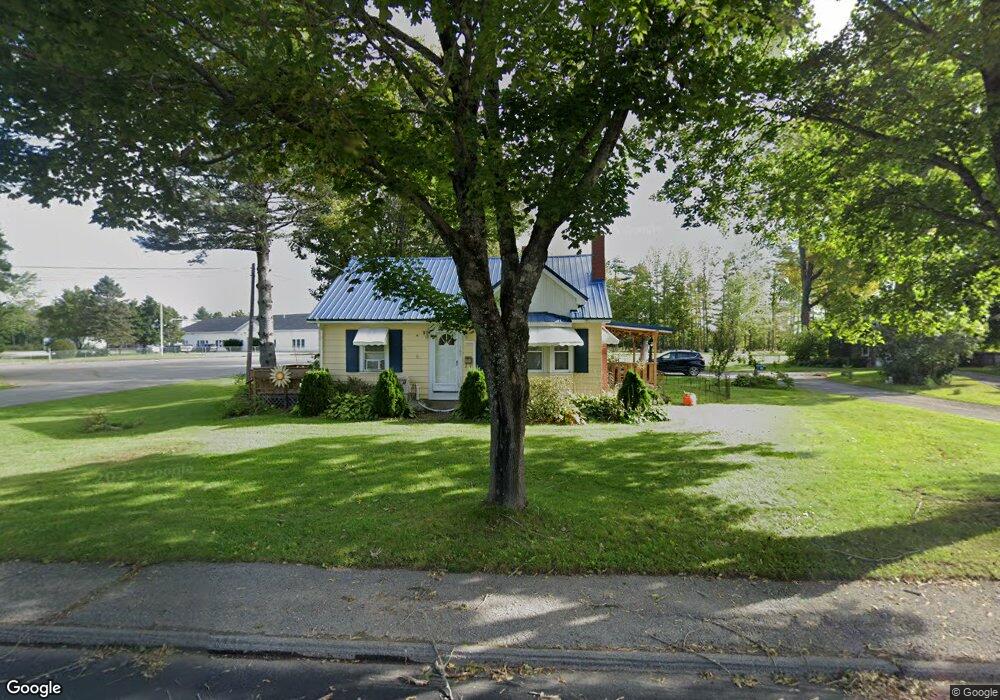
150 Elm St Newport, ME 04953
Estimated Value: $214,000 - $282,000
2
Beds
1
Bath
910
Sq Ft
$274/Sq Ft
Est. Value
About This Home
This home is located at 150 Elm St, Newport, ME 04953 and is currently estimated at $249,381, approximately $274 per square foot. 150 Elm St is a home located in Penobscot County with nearby schools including Sebasticook Valley Elementary School and Nokomis Regional Middle School/High School.
Ownership History
Date
Name
Owned For
Owner Type
Purchase Details
Closed on
Dec 13, 2010
Sold by
Towne Marie S
Bought by
Jones Tina
Current Estimated Value
Home Financials for this Owner
Home Financials are based on the most recent Mortgage that was taken out on this home.
Original Mortgage
$103,626
Outstanding Balance
$68,533
Interest Rate
4.24%
Mortgage Type
FHA
Estimated Equity
$180,848
Purchase Details
Closed on
Jun 17, 2010
Sold by
Towne Terry A
Bought by
Towne Marie S
Create a Home Valuation Report for This Property
The Home Valuation Report is an in-depth analysis detailing your home's value as well as a comparison with similar homes in the area
Home Values in the Area
Average Home Value in this Area
Purchase History
| Date | Buyer | Sale Price | Title Company |
|---|---|---|---|
| Jones Tina | -- | -- | |
| Towne Marie S | -- | -- |
Source: Public Records
Mortgage History
| Date | Status | Borrower | Loan Amount |
|---|---|---|---|
| Open | Towne Marie S | $103,626 |
Source: Public Records
Tax History Compared to Growth
Tax History
| Year | Tax Paid | Tax Assessment Tax Assessment Total Assessment is a certain percentage of the fair market value that is determined by local assessors to be the total taxable value of land and additions on the property. | Land | Improvement |
|---|---|---|---|---|
| 2024 | $3,379 | $193,100 | $40,200 | $152,900 |
| 2023 | $2,942 | $180,500 | $37,600 | $142,900 |
| 2022 | $2,795 | $142,600 | $29,700 | $112,900 |
| 2021 | $2,808 | $136,300 | $28,400 | $107,900 |
| 2020 | $15,814 | $133,800 | $27,900 | $105,900 |
| 2019 | $2,484 | $126,200 | $26,300 | $99,900 |
| 2018 | $2,688 | $126,200 | $26,300 | $99,900 |
| 2017 | $2,500 | $125,000 | $26,300 | $98,700 |
| 2016 | $2,425 | $125,000 | $26,300 | $98,700 |
| 2015 | $2,238 | $125,000 | $26,300 | $98,700 |
| 2014 | $2,150 | $125,000 | $26,300 | $98,700 |
Source: Public Records
Map
Nearby Homes