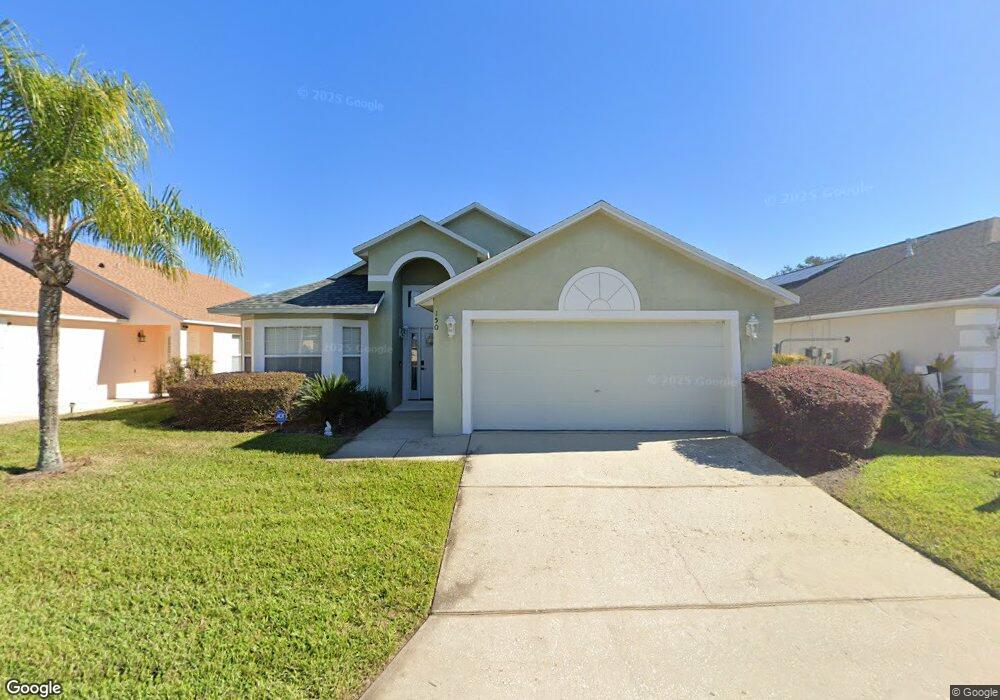
150 High Point Dr Davenport, FL 33837
Estimated Value: $313,438 - $357,000
4
Beds
2
Baths
1,370
Sq Ft
$243/Sq Ft
Est. Value
About This Home
This home is located at 150 High Point Dr, Davenport, FL 33837 and is currently estimated at $333,360, approximately $243 per square foot. 150 High Point Dr is a home located in Polk County with nearby schools including Davenport School Of The Arts, Citrus Ridge Academy: a Civics Academy, and Dundee Elementary Academy.
Ownership History
Date
Name
Owned For
Owner Type
Purchase Details
Closed on
Mar 3, 2016
Sold by
Horton James K and Horton Julia H
Bought by
Sigafoose John and Sigafoose Elizabeth
Current Estimated Value
Home Financials for this Owner
Home Financials are based on the most recent Mortgage that was taken out on this home.
Original Mortgage
$162,011
Outstanding Balance
$129,661
Interest Rate
3.99%
Mortgage Type
FHA
Estimated Equity
$203,699
Purchase Details
Closed on
Mar 23, 2011
Sold by
Bankunited
Bought by
Horton James K and Horton Julia H
Purchase Details
Closed on
Nov 10, 2010
Sold by
Woodhouse Stuart
Bought by
Bankunited
Purchase Details
Closed on
Dec 18, 2002
Sold by
Polyak Homes Inc
Bought by
Bailey John and Bailey Susan
Home Financials for this Owner
Home Financials are based on the most recent Mortgage that was taken out on this home.
Original Mortgage
$135,400
Interest Rate
6.07%
Mortgage Type
New Conventional
Create a Home Valuation Report for This Property
The Home Valuation Report is an in-depth analysis detailing your home's value as well as a comparison with similar homes in the area
Home Values in the Area
Average Home Value in this Area
Purchase History
| Date | Buyer | Sale Price | Title Company |
|---|---|---|---|
| Sigafoose John | $165,000 | Equitable Title Of Celebrati | |
| Horton James K | $101,000 | Bay Title & Escrow Company | |
| Bankunited | $85,200 | None Available | |
| Bailey John | $180,600 | -- |
Source: Public Records
Mortgage History
| Date | Status | Borrower | Loan Amount |
|---|---|---|---|
| Open | Sigafoose John | $162,011 | |
| Previous Owner | Bailey John | $135,400 |
Source: Public Records
Tax History Compared to Growth
Tax History
| Year | Tax Paid | Tax Assessment Tax Assessment Total Assessment is a certain percentage of the fair market value that is determined by local assessors to be the total taxable value of land and additions on the property. | Land | Improvement |
|---|---|---|---|---|
| 2025 | $3,922 | $254,898 | $50,000 | $204,898 |
| 2024 | $3,687 | $240,184 | -- | -- |
| 2023 | $3,687 | $218,349 | $0 | $0 |
| 2022 | $3,375 | $198,499 | $0 | $0 |
| 2021 | $3,004 | $180,454 | $36,000 | $144,454 |
| 2020 | $2,925 | $174,886 | $34,000 | $140,886 |
| 2018 | $2,617 | $148,962 | $32,000 | $116,962 |
| 2017 | $2,464 | $140,405 | $0 | $0 |
| 2016 | $2,474 | $138,031 | $0 | $0 |
| 2015 | $1,901 | $125,483 | $0 | $0 |
| 2014 | $2,098 | $115,018 | $0 | $0 |
Source: Public Records
Map
Nearby Homes
- 110 High Point Dr
- 459 Tivoli Cir
- 316 Tivoli Cir
- 204 Silver Palms Cir
- 118 Sir Phillips Dr
- 204 Fox Loop
- 250 Sir Phillips Dr
- 246 Queen Mary Dr
- 640 Lady Diana Dr
- 371 Pinecrest Loop
- 420 Sir Phillips Dr
- 110 Flatwoods Loop
- 2316 Gifford Dr
- 2308 Gifford Dr
- 2304 Gifford Dr
- 2340 Gifford Dr
- GLEN - UNIT B Plan at Brentwood
- VALE - UNIT A Plan at Brentwood
- 5488 Meadow Walk Dr
- 964 Knollwood Dr
- 140 High Point Dr
- 160 High Point Dr
- 130 High Point Dr
- 202 High Point Dr
- 428 Silver Palms Cir
- 438 Silver Palms Cir
- 438 Silver Palm Dr
- 120 High Point Dr
- 212 High Point Dr
- 151 High Point Dr
- 418 Silver Palms Cir
- 161 High Point Dr
- 141 High Point Dr
- 203 High Point Dr
- 131 High Point Dr
- 408 Silver Palms Cir
- 222 High Point Dr
- 213 High Point Dr
- 121 High Point Dr
- 500 Silver Palms Cir