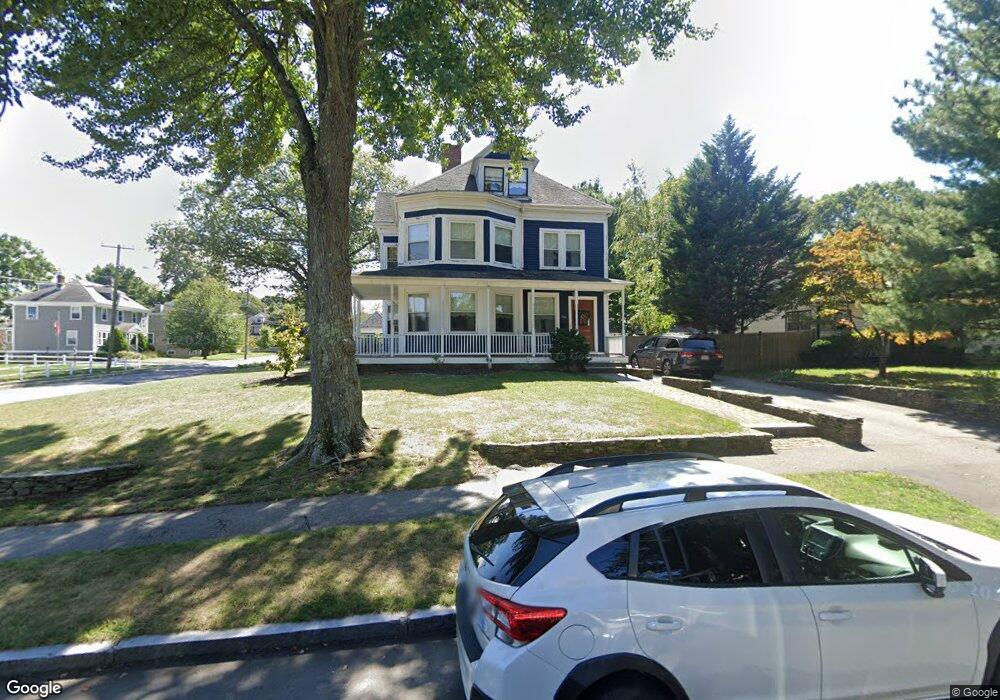
150 Hollis Ave Braintree, MA 02184
North Braintree NeighborhoodEstimated Value: $1,054,000 - $1,431,000
5
Beds
3
Baths
3,094
Sq Ft
$407/Sq Ft
Est. Value
About This Home
This home is located at 150 Hollis Ave, Braintree, MA 02184 and is currently estimated at $1,259,611, approximately $407 per square foot. 150 Hollis Ave is a home located in Norfolk County with nearby schools including Meeting House Montessori School, South Shore SDA School, and Thayer Academy.
Ownership History
Date
Name
Owned For
Owner Type
Purchase Details
Closed on
Mar 11, 2005
Sold by
Queally Denise M
Bought by
Morahan Brian and Morahan Janine
Current Estimated Value
Home Financials for this Owner
Home Financials are based on the most recent Mortgage that was taken out on this home.
Original Mortgage
$425,000
Interest Rate
5.64%
Mortgage Type
Purchase Money Mortgage
Purchase Details
Closed on
Feb 29, 2000
Sold by
Berry Paul F
Bought by
Queally Desmond J and Queally Denise M
Purchase Details
Closed on
Jan 31, 1989
Sold by
Curtin Joseph L
Bought by
Berry Paul F
Create a Home Valuation Report for This Property
The Home Valuation Report is an in-depth analysis detailing your home's value as well as a comparison with similar homes in the area
Home Values in the Area
Average Home Value in this Area
Purchase History
| Date | Buyer | Sale Price | Title Company |
|---|---|---|---|
| Morahan Brian | $765,000 | -- | |
| Queally Desmond J | $420,000 | -- | |
| Berry Paul F | $208,650 | -- | |
| Berry Paul F | $208,650 | -- |
Source: Public Records
Mortgage History
| Date | Status | Borrower | Loan Amount |
|---|---|---|---|
| Open | Berry Paul F | $455,000 | |
| Closed | Morahan Brian | $425,000 | |
| Closed | Morahan Brian | $187,000 | |
| Previous Owner | Berry Paul F | $275,000 |
Source: Public Records
Tax History Compared to Growth
Tax History
| Year | Tax Paid | Tax Assessment Tax Assessment Total Assessment is a certain percentage of the fair market value that is determined by local assessors to be the total taxable value of land and additions on the property. | Land | Improvement |
|---|---|---|---|---|
| 2025 | $11,238 | $1,126,100 | $405,200 | $720,900 |
| 2024 | $10,202 | $1,076,200 | $361,800 | $714,400 |
| 2023 | $9,785 | $1,002,600 | $328,100 | $674,500 |
| 2022 | $9,592 | $964,000 | $289,500 | $674,500 |
| 2021 | $9,194 | $924,000 | $289,500 | $634,500 |
| 2020 | $8,492 | $861,300 | $254,700 | $606,600 |
| 2019 | $8,309 | $823,500 | $254,700 | $568,800 |
| 2018 | $8,184 | $776,500 | $231,600 | $544,900 |
| 2017 | $7,997 | $744,600 | $231,600 | $513,000 |
| 2016 | $7,678 | $699,300 | $208,400 | $490,900 |
| 2015 | $7,542 | $681,300 | $208,400 | $472,900 |
| 2014 | $6,963 | $609,700 | $172,700 | $437,000 |
Source: Public Records
Map
Nearby Homes
- 6 Oak St
- 78 Windemere Cir
- 37 Monatiquot Ave
- 491 Washington St Unit 1
- 63 Dickerman Ln
- 305 Franklin St
- 29 Joseph Rd
- 47 Addison St
- 9 Independence Ave Unit 307
- 6 Franklin St
- 39 Morrison Rd
- 106 Home Park Rd
- 192 Federal Ave Unit B
- 48 Conrad St
- 7 Carter Rd
- 347 Centre St
- 605 Middle St Unit 38
- 21 Totman St Unit 202
- 21 Totman St Unit 309
- 21 Totman St Unit Model-1