
Seller's Agent in 2021
Barbara Bodnar
Coldwell Banker Realty
(917) 386-8636
27 in this area
59 Total Sales
Estimated Value: $86,000
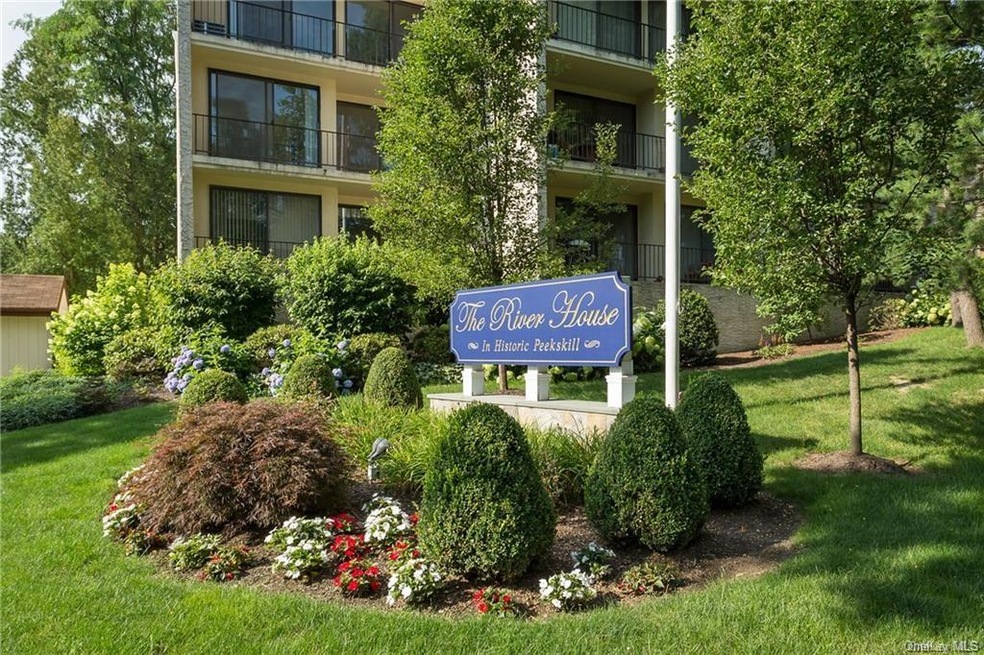
Move right in to this bright , spacious, lovely studio in The Riverhouse. Engineered floors, ready for a new owner. Manicured grounds, laundry on the floor, elevator building, outdoor pool, entertainment area, tennis. Conveniently located to restaurants, parkway, Metro North. Pre approval or proof of funds. Please review updated guidelines for coop requirements. D/I ratio 34%, 20% down payment, no renting, shareholder must reside in unit. Non occupants cannot be listed on contract/stock certificate. Min 2 full years (24 consec. months) of documented required income meeting adm. guidelines, Documented through tax returns, 1099, W2. 24 months doc. prior employment unless retired. Liquid assets before STAR exemption and after DP, equal to 24 months maint charges, assets must be documented to have been in accounts for at least 12 months.. Two months maint. toward cap improvement at closing. Studio cash 42,000/yr. Mortgage 50,000/yr.
Last Agent to Sell the Property
Coldwell Banker Realty License #10301201833 Listed on: 04/12/2021
| Date | Event | Price | List to Sale | Price per Sq Ft |
|---|---|---|---|---|
| 07/15/2021 07/15/21 | Sold | $79,000 | 0.0% | $144 / Sq Ft |
| 05/04/2021 05/04/21 | Pending | -- | -- | -- |
| 04/12/2021 04/12/21 | For Sale | $79,000 | 0.0% | $144 / Sq Ft |
| 08/07/2015 08/07/15 | Rented | $950 | 0.0% | -- |
| 07/08/2015 07/08/15 | Under Contract | -- | -- | -- |
| 06/25/2015 06/25/15 | For Rent | $950 | +11.8% | -- |
| 05/28/2014 05/28/14 | Rented | $850 | -10.5% | -- |
| 04/28/2014 04/28/14 | Under Contract | -- | -- | -- |
| 08/22/2013 08/22/13 | For Rent | $950 | -- | -- |
| Year | Tax Paid | Tax Assessment Tax Assessment Total Assessment is a certain percentage of the fair market value that is determined by local assessors to be the total taxable value of land and additions on the property. | Land | Improvement |
|---|---|---|---|---|
| 2024 | $364,062 | $390,000 | $132,000 | $258,000 |
| 2023 | $340,548 | $390,000 | $132,000 | $258,000 |
| 2022 | $335,279 | $390,000 | $132,000 | $258,000 |
| 2021 | $451,060 | $390,000 | $132,000 | $258,000 |
| 2020 | $304,692 | $390,000 | $132,000 | $258,000 |
| 2019 | $292,725 | $390,000 | $132,000 | $258,000 |
| 2018 | $76,218 | $390,000 | $132,000 | $258,000 |
| 2017 | $0 | $390,000 | $132,000 | $258,000 |
| 2016 | $228,518 | $390,000 | $132,000 | $258,000 |
| 2015 | -- | $390,000 | $132,000 | $258,000 |
| 2014 | -- | $390,000 | $132,000 | $258,000 |
| 2013 | -- | $390,000 | $132,000 | $258,000 |
Seller's Agent in 2021
Barbara Bodnar
Coldwell Banker Realty
(917) 386-8636
27 in this area
59 Total Sales
Source: OneKey® MLS
MLS Number: KEY6108322
Disclaimer: Certain information contained herein is derived from information provided by parties other than Homes.com. All information provided is deemed reliable, but is not guaranteed to be accurate and should be independently verified.
![]() The data relating to real estate for sale or lease on this web site comes in part from OneKey® MLS. Real estate listings held by brokerage firms other than Ten-X are marked with the OneKey® MLS logo or an abbreviated logo and detailed information about them includes the name of the listing broker.
The data relating to real estate for sale or lease on this web site comes in part from OneKey® MLS. Real estate listings held by brokerage firms other than Ten-X are marked with the OneKey® MLS logo or an abbreviated logo and detailed information about them includes the name of the listing broker.
Based on information submitted to the MLS GRID. All data is obtained from various sources and may not have been verified by broker or MLS GRID. Supplied Open House Information is subject to change without notice. All information should be independently reviewed and verified for accuracy. Properties may or may not be listed by the office/agent presenting the information. Some IDX listings have been excluded from this website. IDX information is provided exclusively for personal, non-commercial use, and may not be used for any purpose other than to identify prospective properties consumers may be interested in purchasing.
Information is deemed reliable but not guaranteed.
Copyright 2026 OneKey® MLS. All rights reserved.
Based on information submitted to the MLS GRID
Ask me questions while you tour the home.