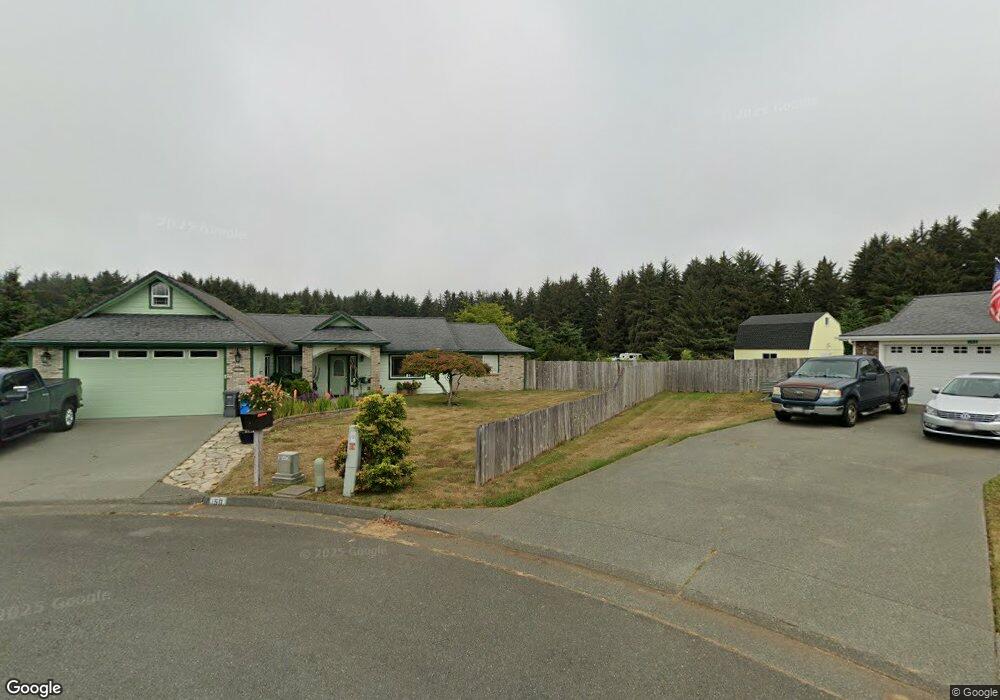
150 Pine View Ct Crescent City, CA 95531
Estimated Value: $446,447 - $508,000
4
Beds
2
Baths
1,912
Sq Ft
$248/Sq Ft
Est. Value
About This Home
This home is located at 150 Pine View Ct, Crescent City, CA 95531 and is currently estimated at $474,362, approximately $248 per square foot. 150 Pine View Ct is a home located in Del Norte County with nearby schools including Joe Hamilton Elementary School, Crescent Elk Middle School, and Del Norte High School.
Ownership History
Date
Name
Owned For
Owner Type
Purchase Details
Closed on
Feb 27, 2026
Sold by
Catherine Balck
Bought by
Barker Balck Family Trust and Barker
Current Estimated Value
Purchase Details
Closed on
Dec 15, 2020
Sold by
Curtis Leona Lorraine
Bought by
Balck Catherine
Home Financials for this Owner
Home Financials are based on the most recent Mortgage that was taken out on this home.
Original Mortgage
$349,100
Interest Rate
2.7%
Mortgage Type
New Conventional
Purchase Details
Closed on
Feb 18, 2016
Sold by
Wolfe Julian M and Wolfe Brooklyn Julia
Bought by
Einman William H
Purchase Details
Closed on
Apr 13, 2012
Sold by
Einman William H and Wolfe Julian M
Bought by
Einman William H and Wolfe Julian M
Home Financials for this Owner
Home Financials are based on the most recent Mortgage that was taken out on this home.
Original Mortgage
$269,010
Interest Rate
3.9%
Mortgage Type
New Conventional
Purchase Details
Closed on
Oct 14, 2009
Sold by
Laputz Paul A and Laputz Zachary P
Bought by
Einman William H and Wolfe Julia M
Home Financials for this Owner
Home Financials are based on the most recent Mortgage that was taken out on this home.
Original Mortgage
$271,500
Interest Rate
5.02%
Mortgage Type
New Conventional
Purchase Details
Closed on
Oct 29, 2008
Sold by
Laputz Nadja F
Bought by
Laputz Nadja F and Laputz Paul
Home Financials for this Owner
Home Financials are based on the most recent Mortgage that was taken out on this home.
Original Mortgage
$150,000
Interest Rate
6.39%
Mortgage Type
Purchase Money Mortgage
Purchase Details
Closed on
Sep 19, 2008
Sold by
Deutsche Bank Trust Company Americas
Bought by
Laputz Nadja F
Home Financials for this Owner
Home Financials are based on the most recent Mortgage that was taken out on this home.
Original Mortgage
$150,000
Interest Rate
6.39%
Mortgage Type
Purchase Money Mortgage
Purchase Details
Closed on
Jul 31, 2008
Sold by
Lundback Tony
Bought by
Deutsche Bank Trust Co Americas and Bankers Trust Co
Home Financials for this Owner
Home Financials are based on the most recent Mortgage that was taken out on this home.
Original Mortgage
$150,000
Interest Rate
6.39%
Mortgage Type
Purchase Money Mortgage
Purchase Details
Closed on
Aug 1, 2003
Sold by
Michetti Brian
Bought by
Lundback Tony
Home Financials for this Owner
Home Financials are based on the most recent Mortgage that was taken out on this home.
Original Mortgage
$159,200
Interest Rate
8.5%
Mortgage Type
Purchase Money Mortgage
Create a Home Valuation Report for This Property
The Home Valuation Report is an in-depth analysis detailing your home's value as well as a comparison with similar homes in the area
Home Values in the Area
Average Home Value in this Area
Purchase History
| Date | Buyer | Sale Price | Title Company |
|---|---|---|---|
| Barker Balck Family Trust | -- | None Listed On Document | |
| Balck Catherine | $367,500 | First American Title Company | |
| Einman William H | -- | None Available | |
| Einman William H | -- | Crescent Land Title Company | |
| Einman William H | -- | Crescent Land Title | |
| Einman William H | $275,000 | Crescent Land Title Company | |
| Laputz Nadja F | -- | None Available | |
| Laputz Nadja F | $275,000 | Chicago Title Company | |
| Deutsche Bank Trust Co Americas | $246,500 | Accommodation | |
| Lundback Tony | $200,000 | First American Title Company |
Source: Public Records
Mortgage History
| Date | Status | Borrower | Loan Amount |
|---|---|---|---|
| Previous Owner | Balck Catherine | $349,100 | |
| Previous Owner | Einman William H | $269,010 | |
| Previous Owner | Einman William H | $271,500 | |
| Previous Owner | Laputz Nadja F | $150,000 | |
| Previous Owner | Lundback Tony | $159,200 | |
| Closed | Lundback Tony | $19,900 |
Source: Public Records
Tax History
| Year | Tax Paid | Tax Assessment Tax Assessment Total Assessment is a certain percentage of the fair market value that is determined by local assessors to be the total taxable value of land and additions on the property. | Land | Improvement |
|---|---|---|---|---|
| 2025 | $4,427 | $397,792 | $97,418 | $300,374 |
| 2024 | $4,237 | $389,993 | $95,508 | $294,485 |
| 2023 | $4,093 | $382,347 | $93,636 | $288,711 |
| 2022 | $4,009 | $374,850 | $91,800 | $283,050 |
| 2021 | $3,983 | $367,500 | $90,000 | $277,500 |
| 2020 | $3,485 | $324,571 | $94,420 | $230,151 |
| 2019 | $3,428 | $318,208 | $92,569 | $225,639 |
| 2018 | $3,373 | $311,969 | $90,754 | $221,215 |
| 2017 | $3,304 | $305,853 | $88,975 | $216,878 |
| 2016 | $3,246 | $299,857 | $87,231 | $212,626 |
| 2015 | $3,173 | $295,354 | $85,921 | $209,433 |
| 2014 | $3,142 | $289,569 | $84,238 | $205,331 |
Source: Public Records
Map
Nearby Homes
- 2422 Nickel Ave
- 525 Humboldt Rd
- 515 Humboldt Rd
- 2460 Kelly St
- 0000 Spring Pike St
- 428 Temple St
- 2710 Oliver Ave
- 0 Pike St
- 2785 Oliver Ave
- 2795 Oliver
- 2422 Dodane Ave
- 901 Ames Way
- 000 State St
- 150 Humboldt Rd
- 2431 Howland Hill Rd Unit 2427 Howland Hill Ro
- 125 Waldo St
- 645 Elk Valley Rd
- 637 Elk Valley Rd
- 102 Sea Foam Dr
- 0 Sea Foam Dr
- 150 Pine View Ct Unit Off Humboldt Road
- 155 Pine View Ct
- 145 Pine View Ct
- 130 Pine View Ct
- 152 Forest View Ct
- 162 Forest View Ct
- 120 Pine View Ct
- 140 Pine View Ct
- 125 Pine View Ct
- 142 Forest View Ct
- 132 Forest View Ct
- 110 Pine View Ct
- 115 Pine View Ct
- 167 Forest View Ct
- 157 Forest View Ct
- 122 Forest View Ct
- 147 Forest View Ct
- 100 Pine View Ct
- 105 Pine View Ct
- 137 Forest View Ct
Your Personal Tour Guide
Ask me questions while you tour the home.