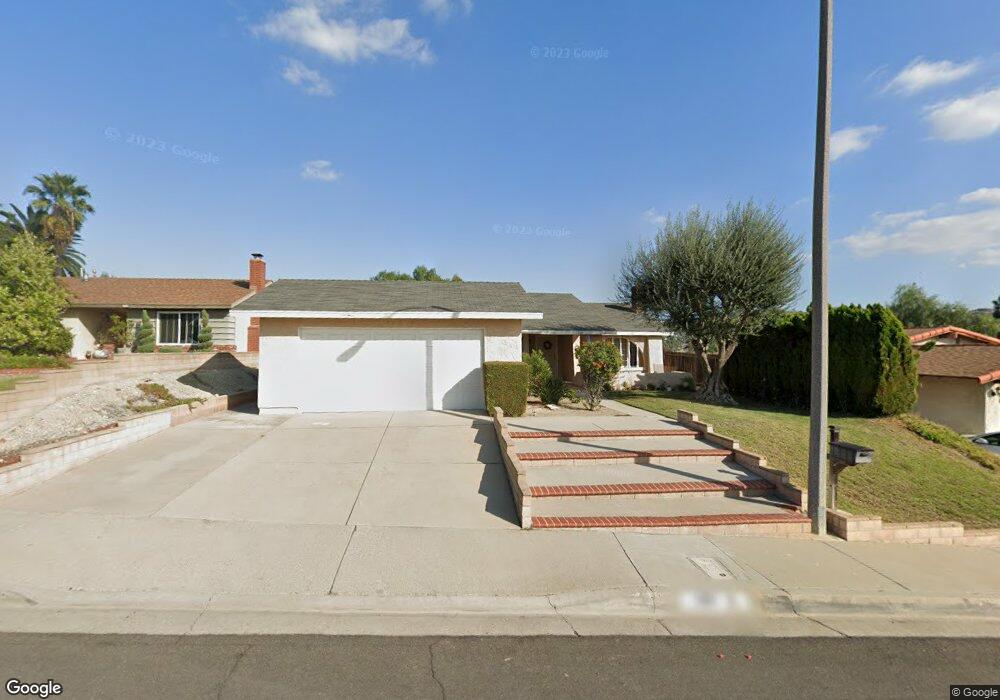
150 Red Cloud Dr Diamond Bar, CA 91765
Estimated Value: $836,626 - $929,000
4
Beds
2
Baths
1,508
Sq Ft
$578/Sq Ft
Est. Value
About This Home
This home is located at 150 Red Cloud Dr, Diamond Bar, CA 91765 and is currently estimated at $871,657, approximately $578 per square foot. 150 Red Cloud Dr is a home located in Los Angeles County with nearby schools including Armstrong Elementary School, Lorbeer Middle School, and Diamond Ranch High School.
Ownership History
Date
Name
Owned For
Owner Type
Purchase Details
Closed on
Jan 2, 2009
Sold by
Ropceanu Radu Calin
Bought by
Sanchez Laura
Current Estimated Value
Home Financials for this Owner
Home Financials are based on the most recent Mortgage that was taken out on this home.
Original Mortgage
$394,790
Outstanding Balance
$247,266
Interest Rate
5.01%
Mortgage Type
FHA
Estimated Equity
$624,391
Purchase Details
Closed on
Jun 24, 1999
Sold by
Ong Benson T
Bought by
Ropceanu Radu Calin and Ropceanu Elena
Home Financials for this Owner
Home Financials are based on the most recent Mortgage that was taken out on this home.
Original Mortgage
$159,200
Interest Rate
7.64%
Mortgage Type
Stand Alone First
Purchase Details
Closed on
Aug 24, 1993
Sold by
Ong Benson T
Bought by
Ong Benson T and Ong Kim L
Home Financials for this Owner
Home Financials are based on the most recent Mortgage that was taken out on this home.
Original Mortgage
$135,000
Interest Rate
7.16%
Create a Home Valuation Report for This Property
The Home Valuation Report is an in-depth analysis detailing your home's value as well as a comparison with similar homes in the area
Home Values in the Area
Average Home Value in this Area
Purchase History
| Date | Buyer | Sale Price | Title Company |
|---|---|---|---|
| Sanchez Laura | $400,000 | Chicago Title Company | |
| Ropceanu Radu Calin | $199,000 | South Coast Title | |
| Ong Benson T | -- | Investors Title Company |
Source: Public Records
Mortgage History
| Date | Status | Borrower | Loan Amount |
|---|---|---|---|
| Open | Sanchez Laura | $394,790 | |
| Previous Owner | Ropceanu Radu Calin | $159,200 | |
| Previous Owner | Ong Benson T | $135,000 |
Source: Public Records
Tax History
| Year | Tax Paid | Tax Assessment Tax Assessment Total Assessment is a certain percentage of the fair market value that is determined by local assessors to be the total taxable value of land and additions on the property. | Land | Improvement |
|---|---|---|---|---|
| 2025 | $6,577 | $515,092 | $367,392 | $147,700 |
| 2024 | $6,577 | $504,993 | $360,189 | $144,804 |
| 2023 | $6,449 | $495,092 | $353,127 | $141,965 |
| 2022 | $6,348 | $485,385 | $346,203 | $139,182 |
| 2021 | $6,206 | $475,868 | $339,415 | $136,453 |
| 2019 | $6,336 | $461,755 | $329,349 | $132,406 |
| 2018 | $5,839 | $452,702 | $322,892 | $129,810 |
| 2016 | $5,480 | $435,124 | $310,354 | $124,770 |
| 2015 | $5,433 | $428,589 | $305,693 | $122,896 |
| 2014 | $5,393 | $420,194 | $299,705 | $120,489 |
Source: Public Records
Map
Nearby Homes
- 158 Cottonwood Cove Dr
- 374 S Prospectors Rd Unit 126
- 22942 Sunset Crossing Rd
- 300 S Prospectors Rd Unit 29
- 312 Torito Ln
- 23641 Golden Springs Dr Unit C-4
- 23601 Golden Springs Dr
- 23675 Bower Cascade Place
- 605 Acolito Place
- 579 Golden Prados Dr
- 23966 Decorah Rd
- 23847 Bower Cascade Place
- 22100 Portofino Dr
- 22092 Portofino Dr
- 22129 Portofino Dr
- 23848 Sunset Crossing Rd
- 22097 Portofino Dr
- 22070 Portofino Dr
- 22085 Manarola Way
- 22060 Manarola Way
- 156 Red Cloud Dr
- 144 Red Cloud Dr
- 202 Red Cloud Dr
- 171 N Rock River Dr
- 136 Red Cloud Dr
- 163 N Rock River Dr
- 175 N Rock River Dr
- 151 Red Cloud Dr
- 157 N Rock River Dr
- 145 Red Cloud Dr
- 157 Red Cloud Dr
- 208 Red Cloud Dr
- 130 Red Cloud Dr
- 203 N Rock River Dr
- 203 Red Cloud Dr
- 137 Red Cloud Dr
- 151 N Rock River Dr
- 214 Red Cloud Dr
- 209 Red Cloud Dr
- 211 N Rock River Dr
Your Personal Tour Guide
Ask me questions while you tour the home.