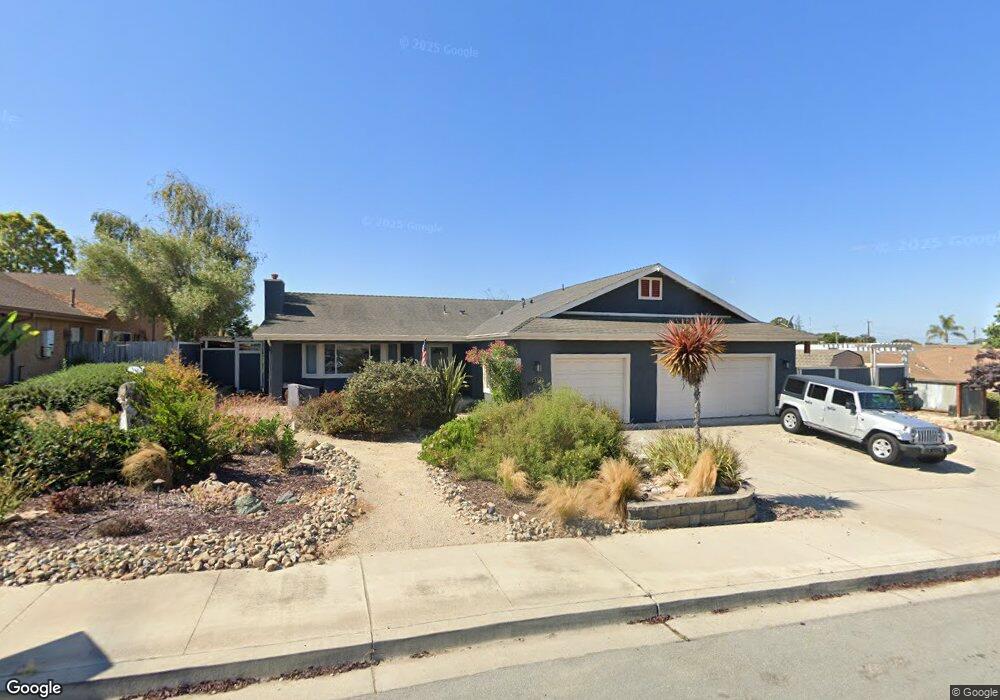
150 S Mesa Rd Nipomo, CA 93444
Estimated Value: $870,639 - $1,054,000
4
Beds
2
Baths
2,044
Sq Ft
$468/Sq Ft
Est. Value
About This Home
This home is located at 150 S Mesa Rd, Nipomo, CA 93444 and is currently estimated at $956,910, approximately $468 per square foot. 150 S Mesa Rd is a home located in San Luis Obispo County with nearby schools including Dana Elementary School, Mesa Middle School, and Nipomo High School.
Ownership History
Date
Name
Owned For
Owner Type
Purchase Details
Closed on
Jul 24, 2016
Sold by
Willett Jeremy N and Palacios Tonya S
Bought by
Willett Jeremy N and Willett Tonya S
Current Estimated Value
Home Financials for this Owner
Home Financials are based on the most recent Mortgage that was taken out on this home.
Original Mortgage
$400,000
Outstanding Balance
$318,908
Interest Rate
3.54%
Mortgage Type
New Conventional
Estimated Equity
$638,002
Purchase Details
Closed on
Aug 21, 2014
Sold by
Palacios Tonya S and Willett Jeremy N
Bought by
Willett Jeremy N and Palacios Tonya S
Home Financials for this Owner
Home Financials are based on the most recent Mortgage that was taken out on this home.
Original Mortgage
$376,000
Interest Rate
4.11%
Mortgage Type
New Conventional
Purchase Details
Closed on
Dec 23, 2010
Sold by
Willett Jeremy N and Palacios Tonya S
Bought by
Palacios Tonya S and Willett Jeremy N
Home Financials for this Owner
Home Financials are based on the most recent Mortgage that was taken out on this home.
Original Mortgage
$378,238
Interest Rate
4.5%
Mortgage Type
FHA
Purchase Details
Closed on
Jul 24, 2009
Sold by
Brand Hal
Bought by
Willett Jeremy N and Palacios Tonya S
Home Financials for this Owner
Home Financials are based on the most recent Mortgage that was taken out on this home.
Original Mortgage
$382,936
Interest Rate
5.19%
Mortgage Type
FHA
Purchase Details
Closed on
Jan 8, 2008
Sold by
Anderson Courtney N
Bought by
Brand Hal and Meyer Sandra T
Home Financials for this Owner
Home Financials are based on the most recent Mortgage that was taken out on this home.
Original Mortgage
$190,000
Interest Rate
6.05%
Mortgage Type
Negative Amortization
Purchase Details
Closed on
Oct 11, 2006
Sold by
Parks Glenda B
Bought by
Parks Glenda B
Home Financials for this Owner
Home Financials are based on the most recent Mortgage that was taken out on this home.
Original Mortgage
$125,000
Interest Rate
6.44%
Mortgage Type
New Conventional
Purchase Details
Closed on
Jan 11, 2002
Sold by
Scott Sherman Lee and Scott Shirley Ann
Bought by
Parks Glenda B
Home Financials for this Owner
Home Financials are based on the most recent Mortgage that was taken out on this home.
Original Mortgage
$53,900
Interest Rate
7.15%
Purchase Details
Closed on
Mar 19, 2001
Sold by
R H Newdoll Construction Inc
Bought by
Scott Sherman Lee and Scott Shirley Ann
Create a Home Valuation Report for This Property
The Home Valuation Report is an in-depth analysis detailing your home's value as well as a comparison with similar homes in the area
Home Values in the Area
Average Home Value in this Area
Purchase History
We collect this data history from publicly available records. To have your information removed, we recommend requesting removal directly through your county’s website.
| Date | Buyer | Sale Price | Title Company |
|---|---|---|---|
| Willett Jeremy N | -- | Chicago Title Company | |
| Willett Jeremy N | -- | Fidelity National Title Co | |
| Palacios Tonya S | -- | Fidelity National Title Co | |
| Willett Jeremy N | $390,000 | Chicago Title Company | |
| Brand Hal | -- | Accommodation | |
| Anderson Courtney N | -- | Fidelity National Title Co | |
| Parks Glenda B | -- | First American Title Co | |
| Parks Glenda B | -- | First American Title Co-Slo | |
| Parks Glenda B | $349,000 | Chicago Title Co | |
| Scott Sherman Lee | $280,000 | Fidelity National Title Co |
Source: Public Records
Mortgage History
We collect this data history from publicly available records. To have your information removed, we recommend requesting removal directly through your county’s website.
| Date | Status | Borrower | Loan Amount |
|---|---|---|---|
| Open | Willett Jeremy N | $400,000 | |
| Closed | Willett Jeremy N | $376,000 | |
| Closed | Palacios Tonya S | $378,238 | |
| Closed | Willett Jeremy N | $382,936 | |
| Previous Owner | Anderson Courtney N | $190,000 | |
| Previous Owner | Parks Glenda B | $125,000 | |
| Previous Owner | Parks Glenda B | $53,900 |
Source: Public Records
Tax History
| Year | Tax Paid | Tax Assessment Tax Assessment Total Assessment is a certain percentage of the fair market value that is determined by local assessors to be the total taxable value of land and additions on the property. | Land | Improvement |
|---|---|---|---|---|
| 2025 | $5,104 | $503,405 | $161,344 | $342,061 |
| 2024 | $5,045 | $493,535 | $158,181 | $335,354 |
| 2023 | $5,045 | $483,859 | $155,080 | $328,779 |
| 2022 | $4,967 | $474,373 | $152,040 | $322,333 |
| 2021 | $4,956 | $465,072 | $149,059 | $316,013 |
| 2020 | $4,899 | $460,304 | $147,531 | $312,773 |
| 2019 | $4,867 | $451,280 | $144,639 | $306,641 |
| 2018 | $4,808 | $442,432 | $141,803 | $300,629 |
| 2017 | $4,716 | $433,758 | $139,023 | $294,735 |
| 2016 | $4,447 | $425,254 | $136,298 | $288,956 |
| 2015 | $4,382 | $418,867 | $134,251 | $284,616 |
| 2014 | $4,218 | $410,663 | $131,622 | $279,041 |
Source: Public Records
Map
Nearby Homes
- 245 Hazel Ln
- 361 Jupiter Dr
- 429 Saturn Ct
- 379 Mars Ct
- 461 Saturn Ct
- 366 Venus Ct
- 468 Neptune Dr
- 785 Bracken Ln
- 184 Alyssum Cir
- 435 Eucalyptus Rd Unit 435-433
- 435 Eucalyptus Rd
- 187 Amaranth Ln
- 719 W Tefft St
- 778 Primrose Ln
- 224 Scarlett Cir
- 236 Scarlett Cir
- 680 Hill St
- 245 N Las Flores Dr
- 245 & 235 N Las Flores Dr
- 341 N Las Flores Dr
Your Personal Tour Guide
Ask me questions while you tour the home.