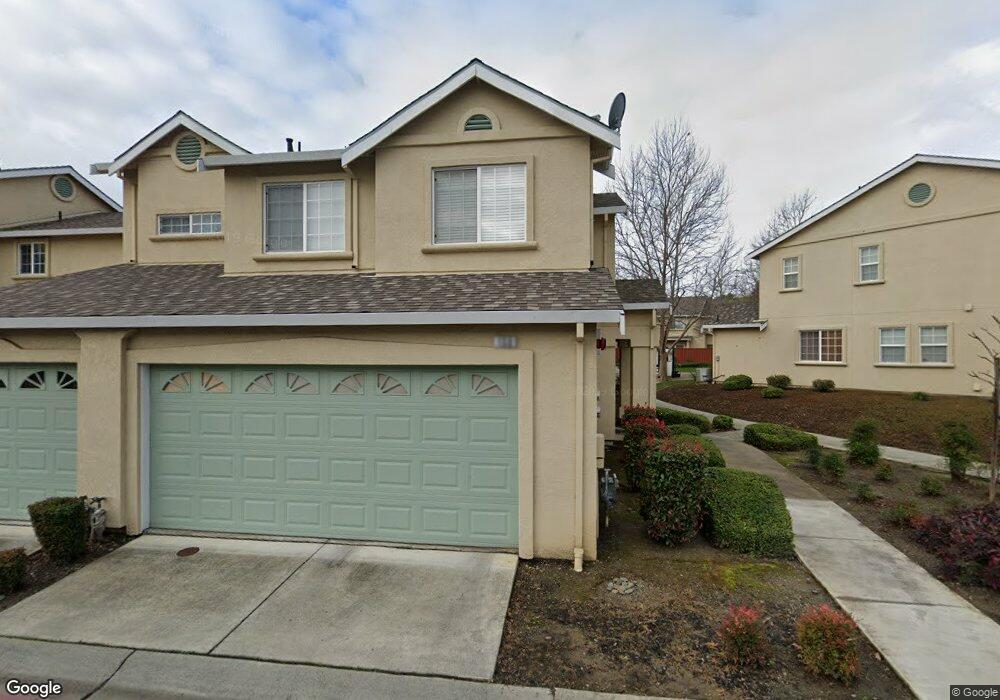
150 Sutherlin Ln Fairfield, CA 94534
Estimated Value: $432,000 - $478,000
3
Beds
3
Baths
1,306
Sq Ft
$345/Sq Ft
Est. Value
About This Home
This home is located at 150 Sutherlin Ln, Fairfield, CA 94534 and is currently estimated at $450,909, approximately $345 per square foot. 150 Sutherlin Ln is a home located in Solano County with nearby schools including K. I. Jones Elementary School, Angelo Rodriguez High School, and Solano Christian Academy.
Ownership History
Date
Name
Owned For
Owner Type
Purchase Details
Closed on
Nov 20, 2001
Sold by
Southbridge Llc
Bought by
Creer Ii Paul A and Greer Diane M
Current Estimated Value
Home Financials for this Owner
Home Financials are based on the most recent Mortgage that was taken out on this home.
Original Mortgage
$156,200
Outstanding Balance
$60,375
Interest Rate
6.57%
Estimated Equity
$390,534
Purchase Details
Closed on
Mar 30, 2001
Sold by
Solano Development Inc
Bought by
Southbridge Llc
Home Financials for this Owner
Home Financials are based on the most recent Mortgage that was taken out on this home.
Original Mortgage
$5,500,000
Interest Rate
6.98%
Mortgage Type
Construction
Purchase Details
Closed on
Mar 5, 2001
Sold by
Solano County Housing Partners I
Bought by
Solano Development Inc
Home Financials for this Owner
Home Financials are based on the most recent Mortgage that was taken out on this home.
Original Mortgage
$5,500,000
Interest Rate
6.98%
Mortgage Type
Construction
Create a Home Valuation Report for This Property
The Home Valuation Report is an in-depth analysis detailing your home's value as well as a comparison with similar homes in the area
Purchase History
| Date | Buyer | Sale Price | Title Company |
|---|---|---|---|
| Creer Ii Paul A | $215,000 | Frontier Title Company | |
| Southbridge Llc | -- | -- | |
| Solano Development Inc | -- | -- |
Source: Public Records
Mortgage History
| Date | Status | Borrower | Loan Amount |
|---|---|---|---|
| Open | Creer Ii Paul A | $156,200 | |
| Previous Owner | Southbridge Llc | $5,500,000 |
Source: Public Records
Tax History
| Year | Tax Paid | Tax Assessment Tax Assessment Total Assessment is a certain percentage of the fair market value that is determined by local assessors to be the total taxable value of land and additions on the property. | Land | Improvement |
|---|---|---|---|---|
| 2025 | $3,554 | $317,168 | $66,473 | $250,695 |
| 2024 | $3,554 | $310,950 | $65,170 | $245,780 |
| 2023 | $3,445 | $304,854 | $63,893 | $240,961 |
| 2022 | $3,442 | $298,878 | $62,641 | $236,237 |
| 2021 | $3,409 | $293,018 | $61,413 | $231,605 |
| 2020 | $3,500 | $290,015 | $60,784 | $229,231 |
| 2019 | $3,419 | $284,330 | $59,593 | $224,737 |
| 2018 | $3,522 | $278,756 | $58,425 | $220,331 |
| 2017 | $3,487 | $273,291 | $57,280 | $216,011 |
| 2016 | $3,461 | $267,933 | $56,157 | $211,776 |
| 2015 | $3,253 | $263,909 | $55,314 | $208,595 |
| 2014 | $3,084 | $246,000 | $37,000 | $209,000 |
Source: Public Records
Map
Nearby Homes
- 185 Canby Way
- 2848 Howe Ct
- 2903 Burbank Dr
- 2795 Vista Palomar
- 2810 Miller Ct
- 2045 Dorland Dr
- 2051 Barbour Dr
- 3114 Lomita Ct
- 2837 Watson Ct
- 1858 Barbour Dr
- 2125 Mecca Ct
- 3456 Norwalk Place
- 2472 Vista Grande
- 3511 Norwalk Place
- 1337 Avon Way
- 3451 Nantucket Dr
- 2119 Tipton Way
- 58 Del Prado Cir
- 1308 Sunningdale Ln
- 1301 Sunningdale Ln
- 149 Sutherlin Ln
- 148 Sutherlin Ln
- 147 Sutherlin Ln
- 151 Sutherlin Ln
- 146 Southbridge Ln
- 130 Sutherlin Ln
- 145 Southbridge Ln
- 152 Sutherlin Ln
- 129 Sutherlin Ln
- 131 Sutherlin Ln
- 132 Sutherlin Ln
- 153 Sutherlin Ln
- 128 Ritter Ct
- 154 Sutherlin Ln
- 143 Southbridge Ln
- 155 Ritter Ct
- 127 Ritter Ct
- 139 Altamount Ct
- 135 Southbridge Ln
- 125 Southbridge Ln
Your Personal Tour Guide
Ask me questions while you tour the home.