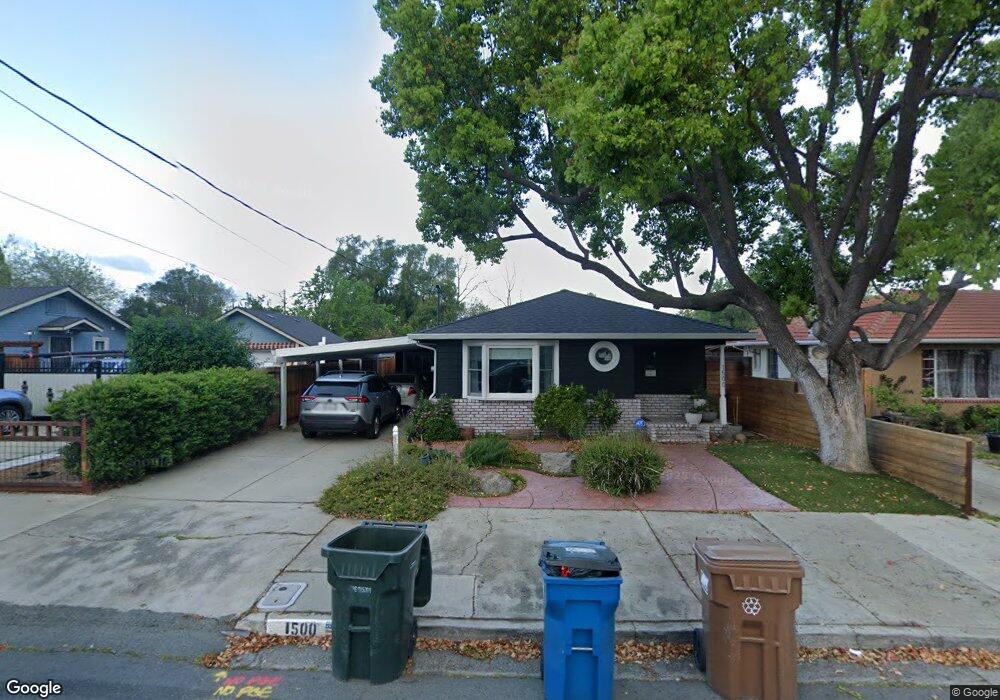
1500 C St Antioch, CA 94509
North Antioch NeighborhoodEstimated Value: $363,000 - $413,666
2
Beds
1
Bath
1,039
Sq Ft
$371/Sq Ft
Est. Value
About This Home
This home is located at 1500 C St, Antioch, CA 94509 and is currently estimated at $385,417, approximately $370 per square foot. 1500 C St is a home located in Contra Costa County with nearby schools including Fremont Elementary School, Antioch Middle School, and Antioch High School.
Ownership History
Date
Name
Owned For
Owner Type
Purchase Details
Closed on
Nov 16, 2022
Sold by
Shirley Eileen Nelson Revocable Living T
Bought by
Collins Shawn Monroe
Current Estimated Value
Purchase Details
Closed on
Sep 17, 2014
Sold by
Nelson Shirley
Bought by
Nelson Shirley
Purchase Details
Closed on
Mar 24, 2009
Sold by
Nelson John
Bought by
Nelson Shirley
Purchase Details
Closed on
Sep 12, 1998
Sold by
Hart Shirley E and Hart Shirley E
Bought by
Nelson John O and Nelson Shirley E
Create a Home Valuation Report for This Property
The Home Valuation Report is an in-depth analysis detailing your home's value as well as a comparison with similar homes in the area
Home Values in the Area
Average Home Value in this Area
Purchase History
| Date | Buyer | Sale Price | Title Company |
|---|---|---|---|
| Collins Shawn Monroe | -- | -- | |
| Nelson Shirley | -- | None Available | |
| Nelson Shirley | -- | None Available | |
| Nelson John O | -- | -- |
Source: Public Records
Tax History
| Year | Tax Paid | Tax Assessment Tax Assessment Total Assessment is a certain percentage of the fair market value that is determined by local assessors to be the total taxable value of land and additions on the property. | Land | Improvement |
|---|---|---|---|---|
| 2025 | $1,914 | $126,623 | $57,663 | $68,960 |
| 2024 | $5,174 | $124,141 | $56,533 | $67,608 |
| 2023 | $5,174 | $425,000 | $300,000 | $125,000 |
| 2022 | $1,767 | $119,323 | $54,339 | $64,984 |
| 2021 | $1,697 | $116,984 | $53,274 | $63,710 |
| 2019 | $1,652 | $113,516 | $51,695 | $61,821 |
| 2018 | $1,592 | $111,291 | $50,682 | $60,609 |
| 2017 | $1,544 | $109,110 | $49,689 | $59,421 |
| 2016 | $1,492 | $106,971 | $48,715 | $58,256 |
| 2015 | $1,467 | $105,365 | $47,984 | $57,381 |
| 2014 | $1,417 | $103,302 | $47,045 | $56,257 |
Source: Public Records
Map
Nearby Homes
Your Personal Tour Guide
Ask me questions while you tour the home.