S
Seller's Agent in 2024
Sam Simmons
Port City Properties, Inc
(910) 264-3610
1 in this area
42 Total Sales
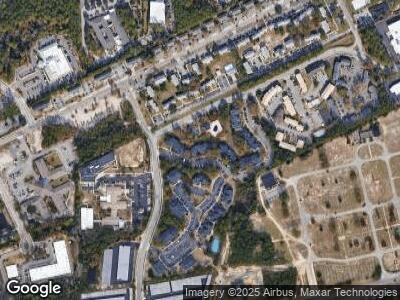
Move in ready 2BR/2BTH condo in popular Bellingham Park. This light and bright unit has just been painted and has brand new carpet. Nice master suite with large bath and walk in closet. The kitchen is open with corian counters, plenty of cabinets, range, refrigerator, disposal and dishwasher. Enjoy views of the conservation area from your covered porch. This unit is on the 3rd floor so you will need to be able to do stairs. The top floor location will be worth it and you will not have neighbors above you. Fire sprinkled building for peace of mind. Close to the medical center and The Pointe at Barclay where you can enjoy a movie or dining. Complex features a gym, large pool, theatre room, tennis courts and car wash station. No pets or smokers please. Available for 1 year lease, security deposit and credit check required.
| Date | Buyer | Sale Price | Title Company |
|---|---|---|---|
| Simmons Samuel Newman | $211,000 | -- | |
| Greene James F | $160,000 | None Available |
| Date | Status | Borrower | Loan Amount |
|---|---|---|---|
| Previous Owner | Greene James F | $113,229 | |
| Previous Owner | Greene James F | $128,000 |
| Date | Event | Price | Change | Sq Ft Price |
|---|---|---|---|---|
| 09/23/2024 09/23/24 | Rented | $1,535 | 0.0% | -- |
| 07/24/2024 07/24/24 | Price Changed | $1,535 | +2.7% | $1 / Sq Ft |
| 07/09/2024 07/09/24 | Price Changed | $1,495 | -2.0% | $1 / Sq Ft |
| 06/24/2024 06/24/24 | Price Changed | $1,525 | -1.3% | $1 / Sq Ft |
| 06/10/2024 06/10/24 | Price Changed | $1,545 | -0.3% | $1 / Sq Ft |
| 05/29/2024 05/29/24 | Price Changed | $1,550 | -1.6% | $1 / Sq Ft |
| 04/26/2024 04/26/24 | Price Changed | $1,575 | +1.6% | $1 / Sq Ft |
| 04/26/2024 04/26/24 | For Rent | $1,550 | +5.1% | -- |
| 02/28/2023 02/28/23 | Rented | $1,475 | 0.0% | -- |
| 02/16/2023 02/16/23 | For Rent | $1,475 | 0.0% | -- |
| 02/15/2023 02/15/23 | Sold | $225,780 | -1.8% | $198 / Sq Ft |
| 12/29/2022 12/29/22 | Pending | -- | -- | -- |
| 12/09/2022 12/09/22 | For Sale | $230,000 | -- | $202 / Sq Ft |
| Year | Tax Paid | Tax Assessment Tax Assessment Total Assessment is a certain percentage of the fair market value that is determined by local assessors to be the total taxable value of land and additions on the property. | Land | Improvement |
|---|---|---|---|---|
| 2023 | $1,189 | $136,700 | $0 | $136,700 |
| 2022 | $1,162 | $136,700 | $0 | $136,700 |
| 2021 | $1,170 | $136,700 | $0 | $136,700 |
| 2020 | $1,103 | $104,700 | $0 | $104,700 |
| 2019 | $1,103 | $104,700 | $0 | $104,700 |
| 2018 | $1,103 | $104,700 | $0 | $104,700 |
| 2017 | $1,103 | $104,700 | $0 | $104,700 |
| 2016 | $1,242 | $112,100 | $0 | $112,100 |
| 2015 | $1,187 | $112,100 | $0 | $112,100 |
| 2014 | $1,137 | $112,100 | $0 | $112,100 |
S
Seller's Agent in 2024
Sam Simmons
Port City Properties, Inc
(910) 264-3610
1 in this area
42 Total Sales

Seller's Agent in 2023
Sarah Burris
Intracoastal Realty Corp
(910) 540-2490
3 in this area
54 Total Sales