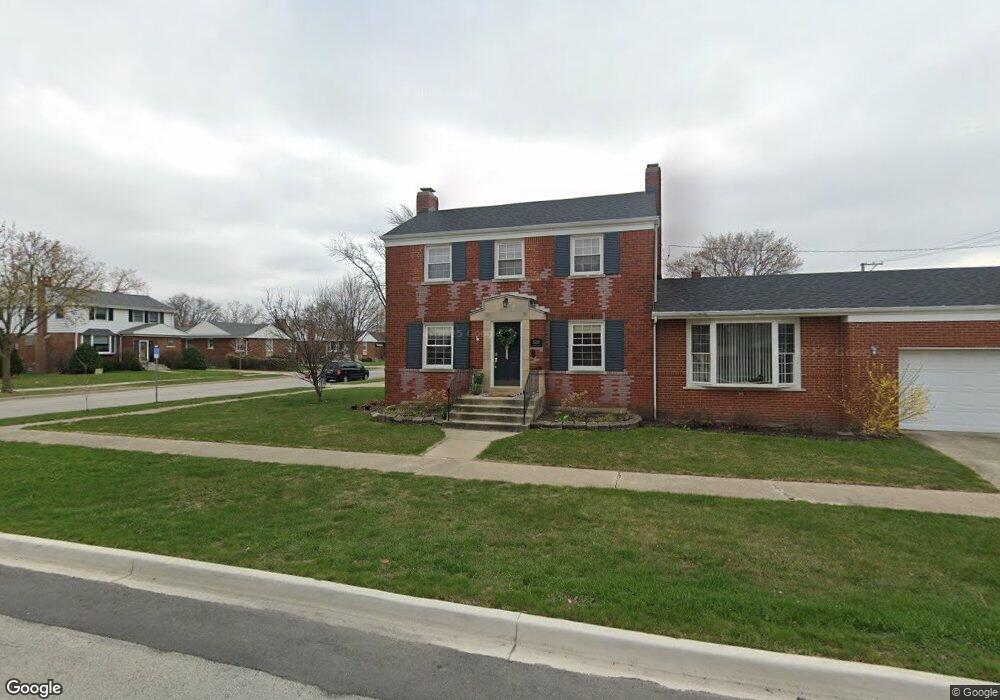
1500 Hull Ave Westchester, IL 60154
Estimated Value: $366,740 - $395,000
4
Beds
3
Baths
1,551
Sq Ft
$248/Sq Ft
Est. Value
About This Home
This home is located at 1500 Hull Ave, Westchester, IL 60154 and is currently estimated at $384,185, approximately $247 per square foot. 1500 Hull Ave is a home located in Cook County with nearby schools including Westchester Primary School, Westchester Intermediate School, and Westchester Middle School.
Ownership History
Date
Name
Owned For
Owner Type
Purchase Details
Closed on
Dec 3, 2004
Sold by
Williams Richard E and Williams Jacqueline R
Bought by
Foley Timothy M and Foley Olga V
Current Estimated Value
Home Financials for this Owner
Home Financials are based on the most recent Mortgage that was taken out on this home.
Original Mortgage
$233,600
Outstanding Balance
$117,687
Interest Rate
5.82%
Mortgage Type
New Conventional
Estimated Equity
$266,498
Purchase Details
Closed on
May 18, 2000
Sold by
Chicago Title Land Trust Company
Bought by
Williams Richard E
Home Financials for this Owner
Home Financials are based on the most recent Mortgage that was taken out on this home.
Original Mortgage
$131,250
Interest Rate
8.14%
Purchase Details
Closed on
May 13, 1997
Sold by
Grove Clara V
Bought by
The Chicago Trust Company and Trust #1103828
Create a Home Valuation Report for This Property
The Home Valuation Report is an in-depth analysis detailing your home's value as well as a comparison with similar homes in the area
Home Values in the Area
Average Home Value in this Area
Purchase History
| Date | Buyer | Sale Price | Title Company |
|---|---|---|---|
| Foley Timothy M | $292,000 | Atgf Inc | |
| Williams Richard E | $175,000 | -- | |
| The Chicago Trust Company | -- | -- |
Source: Public Records
Mortgage History
| Date | Status | Borrower | Loan Amount |
|---|---|---|---|
| Open | Foley Timothy M | $233,600 | |
| Previous Owner | Williams Richard E | $131,250 | |
| Closed | Foley Timothy M | $43,800 |
Source: Public Records
Tax History Compared to Growth
Tax History
| Year | Tax Paid | Tax Assessment Tax Assessment Total Assessment is a certain percentage of the fair market value that is determined by local assessors to be the total taxable value of land and additions on the property. | Land | Improvement |
|---|---|---|---|---|
| 2024 | $5,953 | $26,000 | $4,115 | $21,885 |
| 2023 | $6,088 | $26,000 | $4,115 | $21,885 |
| 2022 | $6,088 | $23,378 | $3,527 | $19,851 |
| 2021 | $5,920 | $23,376 | $3,526 | $19,850 |
| 2020 | $5,849 | $23,376 | $3,526 | $19,850 |
| 2019 | $6,021 | $24,741 | $3,232 | $21,509 |
| 2018 | $6,136 | $25,442 | $3,232 | $22,210 |
| 2017 | $6,034 | $25,442 | $3,232 | $22,210 |
| 2016 | $5,190 | $20,293 | $2,939 | $17,354 |
| 2015 | $5,087 | $20,293 | $2,939 | $17,354 |
| 2014 | $4,985 | $20,293 | $2,939 | $17,354 |
| 2013 | $4,968 | $22,393 | $2,939 | $19,454 |
Source: Public Records
Map
Nearby Homes
- 1406 Portsmouth Ave
- 1318 Balmoral Ave
- 1244 Westchester Blvd
- 10324 Wight St
- 1803 Balmoral Ave
- 1500 Bristol Ave
- 1215 Balmoral Ave
- 1245 S Mannheim Rd Unit 2
- 1247 S Mannheim Rd Unit 3
- 1816 Manchester Ave
- 1813 Manchester Ave
- 1907 Suffolk Ave
- 1900 Manchester Ave
- 10524 Camelot St
- 10531 Camelot St
- 1840 Gardner Rd
- 920 Suffolk Ave
- 10567 Waterford Dr
- 1908 Belleview Ave
- 923 Manchester Ave
- 1506 Hull Ave
- 1510 Hull Ave
- 1501 Westchester Blvd
- 1458 Hull Ave
- 1509 Westchester Blvd
- 1514 Hull Ave
- 1513 Westchester Blvd
- 1457 Westchester Blvd
- 1452 Hull Ave
- 1501 Hull Ave
- 1517 Westchester Blvd
- 1509 Hull Ave
- 1522 Hull Ave
- 1453 Westchester Blvd
- 10120 Chaucer St
- 10120 Chaucer St
- 1444 Hull Ave
- 1444 Hull Ave
- 1515 Hull Ave
- 1523 Westchester Blvd