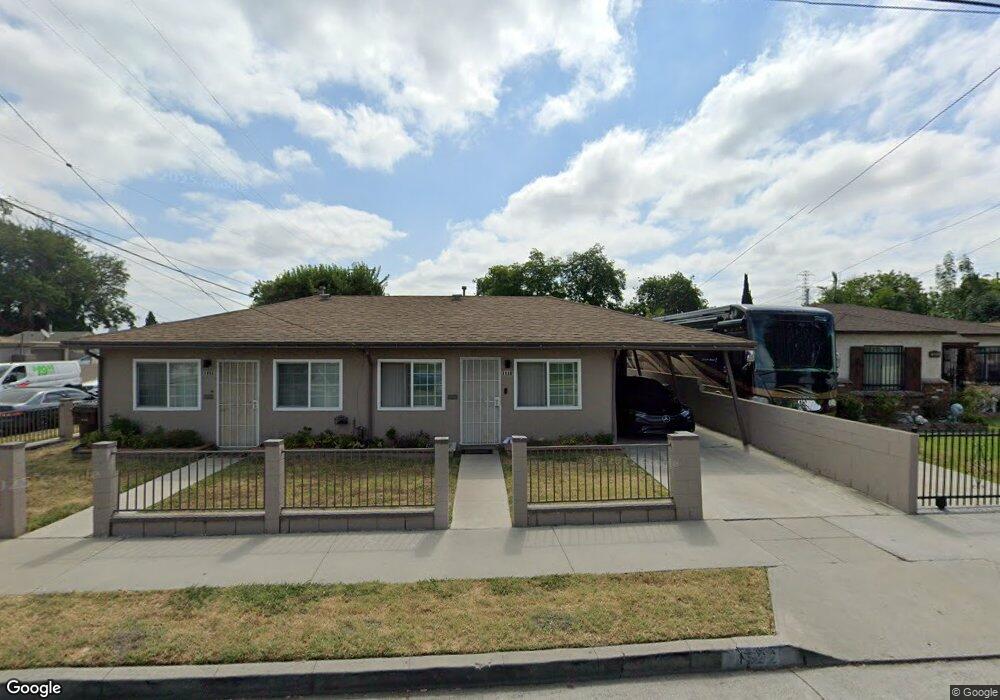
1500 S Tamarind Ave Compton, CA 90220
Estimated Value: $846,000 - $889,000
8
Beds
5
Baths
4,034
Sq Ft
$215/Sq Ft
Est. Value
About This Home
This home is located at 1500 S Tamarind Ave, Compton, CA 90220 and is currently estimated at $866,000, approximately $214 per square foot. 1500 S Tamarind Ave is a home located in Los Angeles County with nearby schools including Robert F. Kennedy Elementary School, Walton Middle School, and Compton High School.
Ownership History
Date
Name
Owned For
Owner Type
Purchase Details
Closed on
Dec 4, 2023
Sold by
Irene Robinson Living Trust
Bought by
Irene Robinson Living Trust and Robinson
Current Estimated Value
Purchase Details
Closed on
Oct 21, 2023
Sold by
Irene Robinson Trust
Bought by
Irene Robinson Living Trust and Robinson
Purchase Details
Closed on
Dec 26, 2017
Sold by
Robin
Bought by
Robin
Home Financials for this Owner
Home Financials are based on the most recent Mortgage that was taken out on this home.
Interest Rate
3.94%
Purchase Details
Closed on
Apr 12, 2012
Sold by
Robinson Irene
Bought by
Robinson Irene and Irene Robinson Trust
Purchase Details
Closed on
May 20, 1998
Sold by
Robinson Irene
Bought by
Robinson Marvin K and Robinson Sonja L
Home Financials for this Owner
Home Financials are based on the most recent Mortgage that was taken out on this home.
Original Mortgage
$169,100
Interest Rate
7.13%
Create a Home Valuation Report for This Property
The Home Valuation Report is an in-depth analysis detailing your home's value as well as a comparison with similar homes in the area
Home Values in the Area
Average Home Value in this Area
Purchase History
| Date | Buyer | Sale Price | Title Company |
|---|---|---|---|
| Irene Robinson Living Trust | -- | None Listed On Document | |
| Irene Robinson Living Trust | -- | None Listed On Document | |
| Robin | -- | -- | |
| Robinson Irene | -- | None Available | |
| Robinson Irene | -- | None Available | |
| Robinson Marvin K | -- | First American Title |
Source: Public Records
Mortgage History
| Date | Status | Borrower | Loan Amount |
|---|---|---|---|
| Previous Owner | Robin | -- | |
| Previous Owner | Robinson Marvin K | $169,100 |
Source: Public Records
Tax History
| Year | Tax Paid | Tax Assessment Tax Assessment Total Assessment is a certain percentage of the fair market value that is determined by local assessors to be the total taxable value of land and additions on the property. | Land | Improvement |
|---|---|---|---|---|
| 2025 | $6,570 | $299,356 | $104,339 | $195,017 |
| 2024 | $6,570 | $293,488 | $102,294 | $191,194 |
| 2023 | $6,474 | $287,735 | $100,289 | $187,446 |
| 2022 | $5,507 | $282,094 | $98,323 | $183,771 |
| 2021 | $5,532 | $276,564 | $96,396 | $180,168 |
| 2020 | $5,442 | $273,729 | $95,408 | $178,321 |
| 2019 | $5,381 | $268,363 | $93,538 | $174,825 |
| 2018 | $5,142 | $263,102 | $91,704 | $171,398 |
| 2016 | $4,863 | $252,888 | $88,144 | $164,744 |
| 2015 | $4,660 | $249,090 | $86,820 | $162,270 |
| 2014 | $4,591 | $244,212 | $85,120 | $159,092 |
Source: Public Records
Map
Nearby Homes
- 214 E Johnson St
- 124 W Caldwell St
- 229 E Reeve St
- 920 S Willowbrook Ave
- 114 E Alondra Blvd
- 420 W Tichenor St
- 1680 S Tartar Ln Unit 42
- 1540 S Pearl Ave
- 105 W Cypress St
- 1300 S California Ave
- 822 S Chester Ave
- 512 S Willowbrook Ave
- 1100 E Tichenor St
- 1423 S Sloan Ave
- 201 Racquet Club Dr
- 621 S Burris Ave
- 501 S Pearl Ave
- 1301 E Alondra Blvd
- 426 W Laurel St
- 6755 Harbor Ave
- 1504 S Tamarind Ave
- 214 E Bennett St
- 1506 S Tamarind Ave
- 1512 S Tamarind Ave
- 216 E Bennett St
- 1412 S Tamarind Ave
- 213 E Bennett St
- 1501 S Tamarind Ave
- 215 E Bennett St
- 1505 S Tamarind Ave
- 1518 S Tamarind Ave
- 1408 S Tamarind Ave
- 1509 S Tamarind Ave
- 219 E Bennett St
- 1513 S Tamarind Ave
- 1413 S Tamarind Ave
- 1522 S Tamarind Ave
- 225 E Bennett St
- 1404 S Tamarind Ave
- 1515 S Tamarind Ave
Your Personal Tour Guide
Ask me questions while you tour the home.