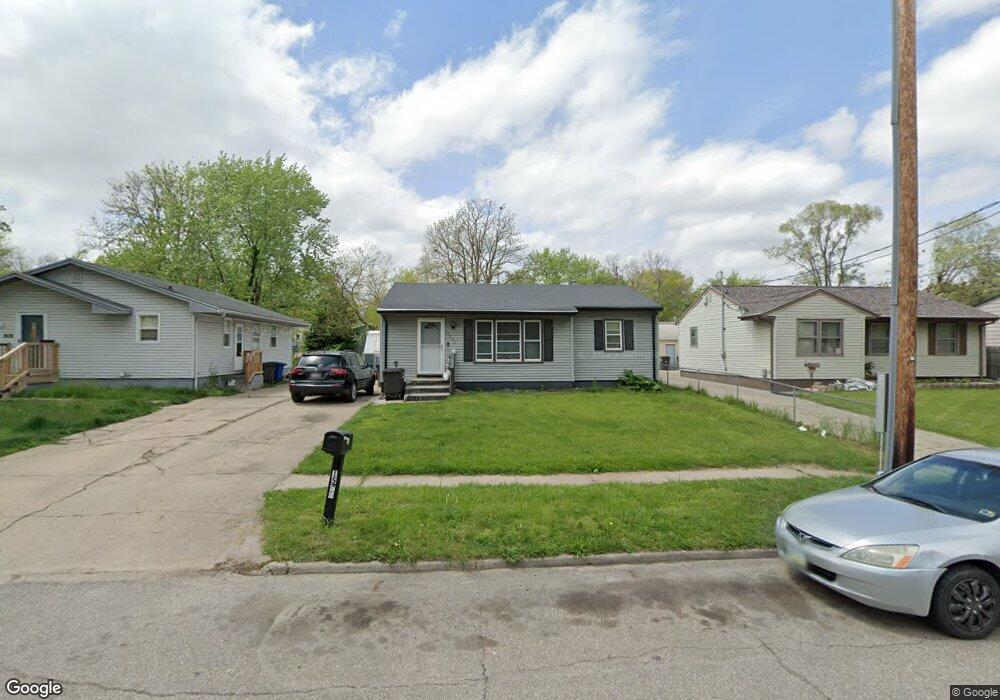
1500 Sampson St Des Moines, IA 50316
Martin Luther King Jr Park NeighborhoodEstimated Value: $160,000 - $185,068
3
Beds
1
Bath
899
Sq Ft
$192/Sq Ft
Est. Value
About This Home
This home is located at 1500 Sampson St, Des Moines, IA 50316 and is currently estimated at $172,517, approximately $191 per square foot. 1500 Sampson St is a home located in Polk County with nearby schools including Garton Elementary School, Hiatt Middle School, and East High School.
Ownership History
Date
Name
Owned For
Owner Type
Purchase Details
Closed on
Jun 30, 2011
Sold by
Secretary Of Housing & Urban Development
Bought by
Baccam Phatsalay
Current Estimated Value
Purchase Details
Closed on
Mar 8, 2011
Sold by
Gmac Mortgage Llc
Bought by
Secretary Of Housing & Urban Developemen
Purchase Details
Closed on
Feb 11, 2011
Sold by
Cavan Tib and Cavan Nguoc
Bought by
Gmac Mortgage Llc
Purchase Details
Closed on
Jun 1, 2006
Sold by
Carpenter William
Bought by
Cavan Tib and Cavan Nguoc
Home Financials for this Owner
Home Financials are based on the most recent Mortgage that was taken out on this home.
Original Mortgage
$91,169
Interest Rate
6.72%
Mortgage Type
FHA
Purchase Details
Closed on
Dec 28, 2005
Sold by
Rose Land & Finance Corp
Bought by
Carpenter William
Purchase Details
Closed on
Dec 1, 2005
Sold by
First National Bank Of America
Bought by
Rose Land & Finance Corp
Create a Home Valuation Report for This Property
The Home Valuation Report is an in-depth analysis detailing your home's value as well as a comparison with similar homes in the area
Home Values in the Area
Average Home Value in this Area
Purchase History
| Date | Buyer | Sale Price | Title Company |
|---|---|---|---|
| Baccam Phatsalay | -- | None Available | |
| Secretary Of Housing & Urban Developemen | -- | None Available | |
| Secretary Of Housing And Urban Developme | -- | None Available | |
| Gmac Mortgage Llc | $131,954 | None Available | |
| Cavan Tib | $92,500 | None Available | |
| Carpenter William | $48,500 | None Available | |
| Rose Land & Finance Corp | -- | None Available |
Source: Public Records
Mortgage History
| Date | Status | Borrower | Loan Amount |
|---|---|---|---|
| Previous Owner | Cavan Tib | $91,169 | |
| Closed | Carpenter William | $0 |
Source: Public Records
Tax History Compared to Growth
Tax History
| Year | Tax Paid | Tax Assessment Tax Assessment Total Assessment is a certain percentage of the fair market value that is determined by local assessors to be the total taxable value of land and additions on the property. | Land | Improvement |
|---|---|---|---|---|
| 2025 | $3,000 | $172,900 | $16,600 | $156,300 |
| 2024 | $3,000 | $152,500 | $14,400 | $138,100 |
| 2023 | $2,374 | $152,500 | $14,400 | $138,100 |
| 2022 | $2,474 | $100,700 | $11,400 | $89,300 |
| 2021 | $2,418 | $105,800 | $11,400 | $94,400 |
| 2020 | $2,512 | $96,900 | $10,400 | $86,500 |
| 2019 | $2,438 | $96,900 | $10,400 | $86,500 |
| 2018 | $2,412 | $90,700 | $9,500 | $81,200 |
| 2017 | $2,266 | $90,700 | $9,500 | $81,200 |
| 2016 | $2,208 | $83,800 | $8,600 | $75,200 |
| 2015 | $2,208 | $83,800 | $8,600 | $75,200 |
| 2014 | $2,064 | $77,700 | $7,900 | $69,800 |
Source: Public Records
Map
Nearby Homes
- 1429 E 17th St
- 1345 Sampson St
- 1536 Stewart St
- 1531 Stewart St
- 1411 Idaho St
- 1526 E Jefferson Ave
- 1306 E 15th St
- 1348 Idaho St
- 1236 Stewart St
- 1266 E 18th St
- 1404 E 19th St
- 1273 E 18th St
- 2009 Glenbrook Dr
- 1602 Wilson Ave
- 1529 E 19th St
- 1613 York St
- 1443 Wilson Ave
- 1400 Mattern Ave
- 716 E 18th St
- 1916 York St
- 1504 Sampson St
- 1508 Sampson St
- 1432 Sampson St
- 1503 Mccormick St
- 1505 Mccormick St
- 1512 Sampson St
- 1433 Mccormick St
- 1509 Mccormick St
- 1501 Sampson St
- 1424 Sampson St
- 1505 Sampson St
- 1516 Sampson St
- 1429 Mccormick St
- 1513 Mccormick St
- 1439 Sampson St
- 1509 Sampson St
- 1425 Mccormick St
- 1513 Sampson St
- 1517 Mccormick St
- 1420 Sampson St