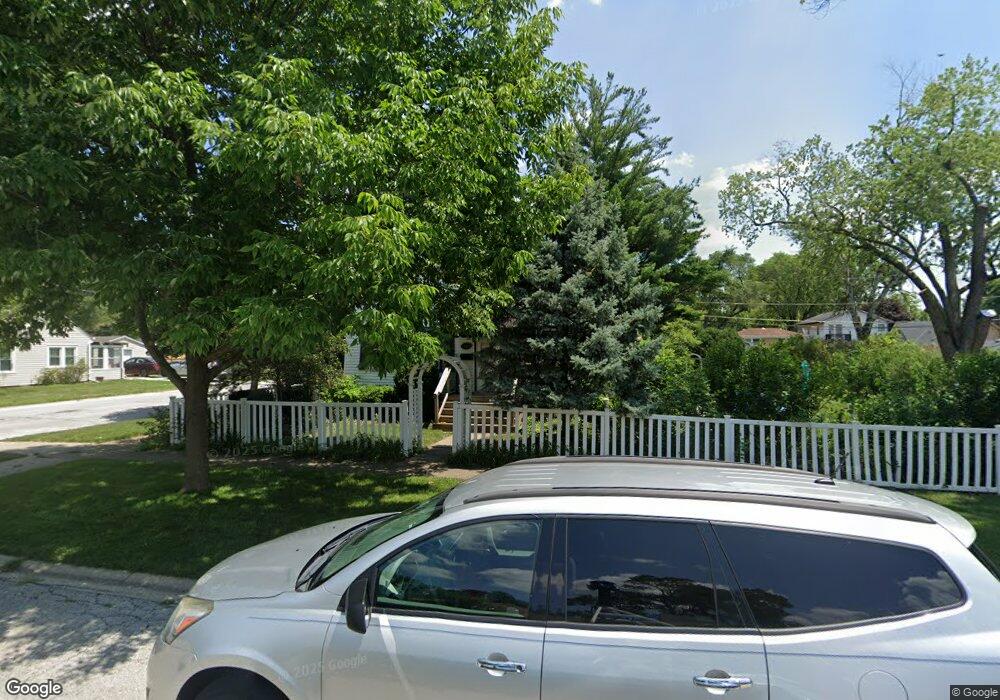
15001 Avers Ave Midlothian, IL 60445
Estimated Value: $230,347 - $239,000
3
Beds
2
Baths
1,292
Sq Ft
$183/Sq Ft
Est. Value
About This Home
This home is located at 15001 Avers Ave, Midlothian, IL 60445 and is currently estimated at $236,087, approximately $182 per square foot. 15001 Avers Ave is a home located in Cook County with nearby schools including Central Park Elementary School, Bremen High School, and St. Christopher School.
Ownership History
Date
Name
Owned For
Owner Type
Purchase Details
Closed on
Jan 24, 2024
Sold by
Berna Rebecca S
Bought by
Rebecca S Berna Declaration Of Trust and Berna
Current Estimated Value
Purchase Details
Closed on
Mar 29, 2006
Sold by
Fiorenzo Anthony and Fiorenzo Tony
Bought by
Berna Rebecca S
Home Financials for this Owner
Home Financials are based on the most recent Mortgage that was taken out on this home.
Original Mortgage
$110,000
Interest Rate
6.33%
Mortgage Type
Fannie Mae Freddie Mac
Purchase Details
Closed on
Jul 14, 2003
Sold by
Mb Financial Bank
Bought by
The Patricia R Hausler Trust
Home Financials for this Owner
Home Financials are based on the most recent Mortgage that was taken out on this home.
Original Mortgage
$144,000
Interest Rate
5.31%
Mortgage Type
Unknown
Purchase Details
Closed on
May 10, 1999
Sold by
Hausler Patricia R
Bought by
Hausler Patricia R
Create a Home Valuation Report for This Property
The Home Valuation Report is an in-depth analysis detailing your home's value as well as a comparison with similar homes in the area
Home Values in the Area
Average Home Value in this Area
Purchase History
| Date | Buyer | Sale Price | Title Company |
|---|---|---|---|
| Rebecca S Berna Declaration Of Trust | -- | None Listed On Document | |
| Berna Rebecca S | $175,000 | Pntn | |
| The Patricia R Hausler Trust | $144,000 | Cti | |
| Hausler Patricia R | -- | -- |
Source: Public Records
Mortgage History
| Date | Status | Borrower | Loan Amount |
|---|---|---|---|
| Previous Owner | Berna Rebecca S | $110,000 | |
| Previous Owner | The Patricia R Hausler Trust | $144,000 |
Source: Public Records
Tax History
| Year | Tax Paid | Tax Assessment Tax Assessment Total Assessment is a certain percentage of the fair market value that is determined by local assessors to be the total taxable value of land and additions on the property. | Land | Improvement |
|---|---|---|---|---|
| 2025 | $1,875 | $16,000 | $1,848 | $14,152 |
| 2024 | $1,875 | $16,000 | $1,848 | $14,152 |
| 2023 | $2,401 | $16,000 | $1,848 | $14,152 |
| 2022 | $2,401 | $12,737 | $1,584 | $11,153 |
| 2021 | $3,045 | $12,736 | $1,584 | $11,152 |
| 2020 | $3,076 | $12,736 | $1,584 | $11,152 |
| 2019 | $3,417 | $11,297 | $1,452 | $9,845 |
| 2018 | $3,361 | $11,297 | $1,452 | $9,845 |
| 2017 | $3,698 | $12,352 | $1,452 | $10,900 |
| 2016 | $2,853 | $9,147 | $1,320 | $7,827 |
| 2015 | $2,737 | $9,147 | $1,320 | $7,827 |
| 2014 | $3,129 | $10,254 | $1,320 | $8,934 |
| 2013 | $2,518 | $9,513 | $1,320 | $8,193 |
Source: Public Records
Map
Nearby Homes
- 15031 Hamlin Ave
- 15035 Harding Ave
- 15115 Springfield Ave
- 15112 Ridgeway Ave
- 14839 Lawndale Ave
- 14970 Pulaski Rd Unit 5
- 4010 150th St Unit 10
- 14903 Terrace Ln
- 15222 Hamlin Ave
- 14837 Karlov Ave
- 3625 147th St
- 4031 147th St
- 14613 Keystone Ave
- 14618 Keystone Ave
- 14539 Crawford Ave
- 3808 153rd Place
- 14820 Turner Ave
- 14301 Hamlin Ave
- 14503 Waverly Ave
- 3851 153rd Place
- 15011 Avers Ave
- 14959 Avers Ave
- 15000 Hamlin Ave
- 15006 Hamlin Ave
- 14953 Avers Ave
- 15010 Hamlin Ave
- 14958 Hamlin Ave
- 15017 Avers Ave
- 15012 Hamlin Ave
- 14952 Hamlin Ave
- 14952 Hamlin Ave
- 15000 Avers Ave
- 15006 Avers Ave
- 15016 Hamlin Ave
- 15010 Avers Ave
- 15014 Avers Ave
- 14958 Avers Ave
- 15025 Avers Ave
- 15024 Hamlin Ave
- 15024 Hamlin Ave
Your Personal Tour Guide
Ask me questions while you tour the home.