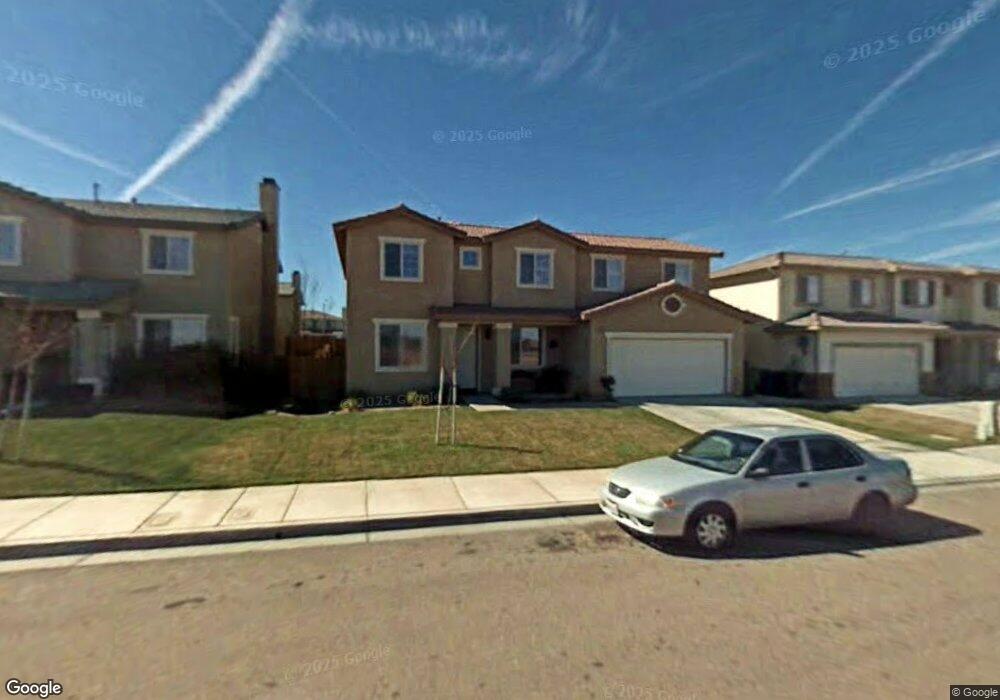
15008 Skipper Ln Victorville, CA 92394
Estimated Value: $461,000 - $520,000
4
Beds
3
Baths
2,783
Sq Ft
$172/Sq Ft
Est. Value
About This Home
This home is located at 15008 Skipper Ln, Victorville, CA 92394 and is currently estimated at $478,239, approximately $171 per square foot. 15008 Skipper Ln is a home located in San Bernardino County with nearby schools including Brentwood Elementary School, Village Elementary School, and Challenger School Of Sports And Fitness.
Ownership History
Date
Name
Owned For
Owner Type
Purchase Details
Closed on
Dec 7, 2012
Sold by
Kuoch Kheng Song
Bought by
Kuoch Chan Quynh
Current Estimated Value
Home Financials for this Owner
Home Financials are based on the most recent Mortgage that was taken out on this home.
Original Mortgage
$188,750
Outstanding Balance
$130,650
Interest Rate
3.35%
Mortgage Type
New Conventional
Estimated Equity
$347,589
Purchase Details
Closed on
Feb 25, 2007
Sold by
Kuoch Chan Quynh
Bought by
Kuoch Kheng Song and Kuoch Chan Quynh
Purchase Details
Closed on
Jan 20, 2004
Sold by
Kuoch Kheng Song
Bought by
Kuoch Chan Quynh
Purchase Details
Closed on
Nov 17, 2003
Sold by
Covenant Brentwood
Bought by
Kuoch Chan Quynh
Home Financials for this Owner
Home Financials are based on the most recent Mortgage that was taken out on this home.
Original Mortgage
$209,655
Interest Rate
5.79%
Mortgage Type
Purchase Money Mortgage
Create a Home Valuation Report for This Property
The Home Valuation Report is an in-depth analysis detailing your home's value as well as a comparison with similar homes in the area
Purchase History
| Date | Buyer | Sale Price | Title Company |
|---|---|---|---|
| Kuoch Chan Quynh | -- | Spl Title Services | |
| Kuoch Chan Quynh | -- | Spl Title Services | |
| Kuoch Kheng Song | -- | None Available | |
| Kuoch Chan Quynh | -- | Fidelity/Riverside | |
| Kuoch Chan Quynh | $221,500 | Fidelity/Riverside |
Source: Public Records
Mortgage History
| Date | Status | Borrower | Loan Amount |
|---|---|---|---|
| Open | Kuoch Chan Quynh | $188,750 | |
| Previous Owner | Kuoch Chan Quynh | $209,655 |
Source: Public Records
Tax History
| Year | Tax Paid | Tax Assessment Tax Assessment Total Assessment is a certain percentage of the fair market value that is determined by local assessors to be the total taxable value of land and additions on the property. | Land | Improvement |
|---|---|---|---|---|
| 2025 | $4,023 | $314,742 | $62,948 | $251,794 |
| 2024 | $3,769 | $308,571 | $61,714 | $246,857 |
| 2023 | $3,734 | $302,521 | $60,504 | $242,017 |
| 2022 | $3,673 | $296,590 | $59,318 | $237,272 |
| 2021 | $3,608 | $290,775 | $58,155 | $232,620 |
| 2020 | $3,546 | $287,794 | $57,559 | $230,235 |
| 2019 | $3,488 | $282,151 | $56,430 | $225,721 |
| 2018 | $3,713 | $276,619 | $55,324 | $221,295 |
| 2017 | $3,476 | $258,900 | $51,500 | $207,400 |
| 2016 | $3,223 | $239,700 | $47,700 | $192,000 |
| 2015 | $2,917 | $221,000 | $44,000 | $177,000 |
| 2014 | $2,774 | $192,100 | $38,000 | $154,100 |
Source: Public Records
Map
Nearby Homes
- 13974 Palomino Ct
- 13730 Gobi Ct
- 14761 Coachman Rd
- 14106 Gray Ln
- 13673 Silversand St
- 13970 Doria Cir
- 15082 Zircon Dr
- 14776 Shetland Ct
- 14751 Shetland Ct
- 14979 Buckskin Rd
- 15133 Pasture Way
- 13944 Clydesdale Run Ln
- 14819 Grasshopper Ct
- 14993 Brown Ln
- 14028 Gale Dr
- 15284 Sunchaser St
- 14180 Dressage Rd
- 15068 Brucite Rd
- 14268 Caballo Ct
- 13720 Dove Ct
- 15016 Skipper Ln
- 14998 Skipper Ln
- 15005 Leaf Ln
- 14997 Leaf Ln
- 15013 Leaf Ln
- 15024 Skipper Ln
- 14990 Skipper Ln
- 14989 Leaf Ln
- 15021 Leaf Ln
- 14980 Skipper Ln
- 15032 Skipper Ln
- 14979 Leaf Ln
- 15029 Leaf Ln
- 14970 Skipper Ln
- 15040 Skipper Ln
- 14969 Leaf Ln
- 15041 Leaf Ln
- 15000 Leaf Ln
- 15016 Leaf Ln
- 14990 Leaf Ln
Your Personal Tour Guide
Ask me questions while you tour the home.