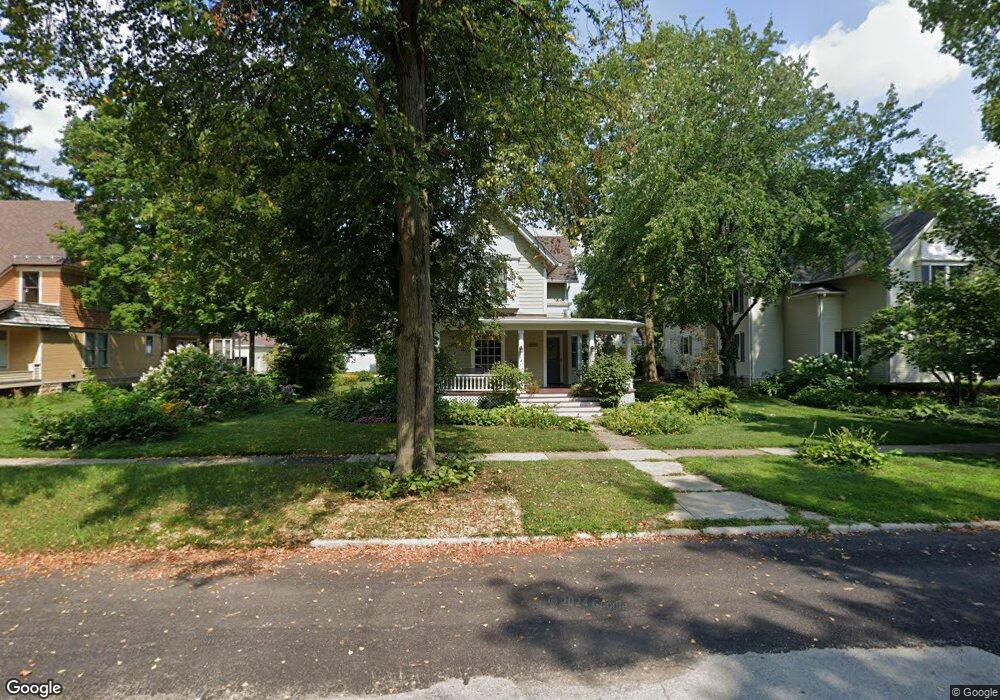
15009 S Bartlett Ave Plainfield, IL 60544
East Plainfield NeighborhoodEstimated Value: $410,568 - $493,000
3
Beds
2
Baths
2,020
Sq Ft
$223/Sq Ft
Est. Value
About This Home
This home is located at 15009 S Bartlett Ave, Plainfield, IL 60544 and is currently estimated at $450,892, approximately $223 per square foot. 15009 S Bartlett Ave is a home located in Will County with nearby schools including Central Elementary School, Indian Trail Middle School, and Plainfield Central High School.
Ownership History
Date
Name
Owned For
Owner Type
Purchase Details
Closed on
Oct 23, 2018
Sold by
Brand Christina R and Woodall Christina R
Bought by
Brand Christina R and Brand Michael H
Current Estimated Value
Home Financials for this Owner
Home Financials are based on the most recent Mortgage that was taken out on this home.
Original Mortgage
$183,500
Outstanding Balance
$114,621
Interest Rate
4.7%
Mortgage Type
New Conventional
Estimated Equity
$336,271
Purchase Details
Closed on
Mar 11, 2011
Sold by
Woodall Kevin L and Woodall Christina R
Bought by
Woodall Christina R
Purchase Details
Closed on
Jul 30, 2001
Sold by
Sticker Mary Jane
Bought by
Woodall Kevin L and Woodall Christina R
Home Financials for this Owner
Home Financials are based on the most recent Mortgage that was taken out on this home.
Original Mortgage
$198,000
Interest Rate
7.14%
Create a Home Valuation Report for This Property
The Home Valuation Report is an in-depth analysis detailing your home's value as well as a comparison with similar homes in the area
Home Values in the Area
Average Home Value in this Area
Purchase History
| Date | Buyer | Sale Price | Title Company |
|---|---|---|---|
| Brand Christina R | -- | Title Source Inc | |
| Woodall Christina R | -- | None Available | |
| Woodall Kevin L | $274,000 | Chicago Title Insurance Co |
Source: Public Records
Mortgage History
| Date | Status | Borrower | Loan Amount |
|---|---|---|---|
| Open | Brand Christina R | $183,500 | |
| Closed | Woodall Kevin L | $198,000 |
Source: Public Records
Tax History
| Year | Tax Paid | Tax Assessment Tax Assessment Total Assessment is a certain percentage of the fair market value that is determined by local assessors to be the total taxable value of land and additions on the property. | Land | Improvement |
|---|---|---|---|---|
| 2024 | $8,739 | $126,535 | $31,038 | $95,497 |
| 2023 | $8,739 | $114,284 | $28,033 | $86,251 |
| 2022 | $8,078 | $105,519 | $25,883 | $79,636 |
| 2021 | $7,625 | $98,616 | $24,190 | $74,426 |
| 2020 | $7,514 | $95,818 | $23,504 | $72,314 |
| 2019 | $7,245 | $91,298 | $22,395 | $68,903 |
| 2018 | $6,648 | $82,696 | $21,041 | $61,655 |
| 2017 | $6,437 | $78,586 | $19,995 | $58,591 |
| 2016 | $6,272 | $74,951 | $19,070 | $55,881 |
| 2015 | $5,668 | $70,212 | $17,864 | $52,348 |
| 2014 | $5,668 | $65,145 | $21,370 | $43,775 |
| 2013 | $5,668 | $65,145 | $21,370 | $43,775 |
Source: Public Records
Map
Nearby Homes
- 25446 W Emory Ln
- 25503 W Emory Ln
- 23909 W Main St
- 14816 S Penn Rd
- 15405 S Joliet Rd
- 14632 S Kearns Dr
- 14946 S Darr Dr
- 14905 S Henebry Ln
- 14942 S Darr Dr
- 000 Wood Farm Rd
- 25017 W Soldier Way
- 14932 S Henebry Ln
- 25518 W Stockwell Dr
- 14860 S Henebry Ln
- 15037 S Darr Dr
- 25500 W Alabaster Cir
- 14853 S Henebry Ln
- 25450 W Alabaster Cir
- 25531 W Alabaster Cir
- 14953 S Mccarthy Cir
- 15013 S Bartlett Ave
- 15005 S Bartlett Ave
- 15017 S Bartlett Ave
- 712 N Bartlett Ave
- 15021 S Bartlett Ave
- 14927 S Bartlett Ave
- 15025 S Bartlett Ave
- 15004 S Bartlett Ave
- 15010 S Bartlett Ave
- 15029 S Bartlett Ave
- 15004 S Bartlett Ave
- 15018 S Bartlett Ave
- 14925 S Bartlett Ave
- 15012 S Center St
- 15016 S Center St
- 14930 S Bartlett Ave
- 15006 S Center St
- 15002 S Center St
- 15022 S Bartlett Ave
- 15033 S Bartlett Ave
Your Personal Tour Guide
Ask me questions while you tour the home.