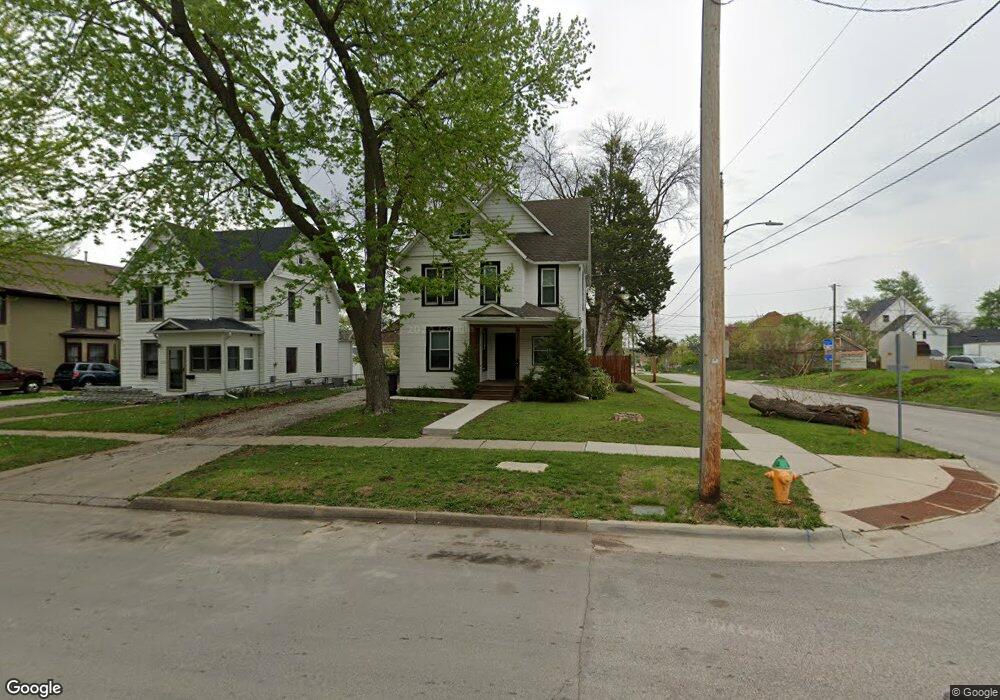
1501 9th St Des Moines, IA 50314
River Bend NeighborhoodEstimated Value: $148,511 - $217,000
4
Beds
2
Baths
1,733
Sq Ft
$98/Sq Ft
Est. Value
About This Home
This home is located at 1501 9th St, Des Moines, IA 50314 and is currently estimated at $170,128, approximately $98 per square foot. 1501 9th St is a home located in Polk County with nearby schools including Moulton Elementary School, Harding Middle School, and North High School.
Ownership History
Date
Name
Owned For
Owner Type
Purchase Details
Closed on
Nov 8, 2022
Sold by
Lenox Dominique and Lenox Maggie Jean
Bought by
Pivot Holdings Llc
Current Estimated Value
Home Financials for this Owner
Home Financials are based on the most recent Mortgage that was taken out on this home.
Original Mortgage
$175,000
Outstanding Balance
$167,022
Interest Rate
7.08%
Mortgage Type
New Conventional
Estimated Equity
$3,106
Purchase Details
Closed on
Dec 21, 2021
Sold by
Dooley Michael L
Bought by
Kenoyer And Associates Llc
Purchase Details
Closed on
Jun 4, 1997
Sold by
Dooley Michael L
Bought by
Mcmillion Herbert L
Create a Home Valuation Report for This Property
The Home Valuation Report is an in-depth analysis detailing your home's value as well as a comparison with similar homes in the area
Home Values in the Area
Average Home Value in this Area
Purchase History
| Date | Buyer | Sale Price | Title Company |
|---|---|---|---|
| Pivot Holdings Llc | -- | -- | |
| Pivot Holdings Llc | -- | None Listed On Document | |
| Kenoyer And Associates Llc | $46,000 | None Available | |
| Mcmillion Herbert L | $18,500 | -- |
Source: Public Records
Mortgage History
| Date | Status | Borrower | Loan Amount |
|---|---|---|---|
| Open | Pivot Holdings Llc | $175,000 | |
| Closed | Pivot Holdings Llc | $175,000 |
Source: Public Records
Tax History Compared to Growth
Tax History
| Year | Tax Paid | Tax Assessment Tax Assessment Total Assessment is a certain percentage of the fair market value that is determined by local assessors to be the total taxable value of land and additions on the property. | Land | Improvement |
|---|---|---|---|---|
| 2025 | $1,906 | $135,900 | $9,300 | $126,600 |
| 2024 | $1,906 | $96,900 | $8,200 | $88,700 |
| 2023 | $1,714 | $96,900 | $8,200 | $88,700 |
| 2022 | $1,549 | $72,700 | $6,300 | $66,400 |
| 2021 | $1,296 | $72,700 | $6,300 | $66,400 |
| 2020 | $1,338 | $63,800 | $5,600 | $58,200 |
| 2019 | $1,340 | $63,800 | $5,600 | $58,200 |
| 2018 | $1,318 | $61,600 | $5,400 | $56,200 |
| 2017 | $1,194 | $61,600 | $5,400 | $56,200 |
| 2016 | $1,156 | $55,900 | $4,900 | $51,000 |
| 2015 | $1,156 | $55,900 | $4,900 | $51,000 |
| 2014 | $1,040 | $51,200 | $4,600 | $46,600 |
Source: Public Records
Map
Nearby Homes