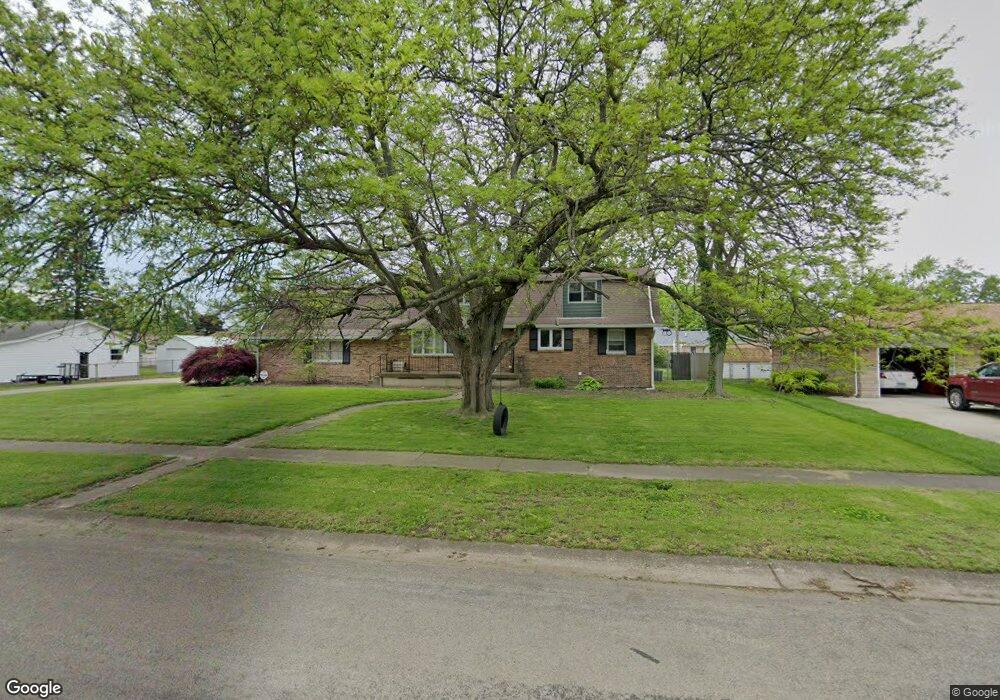
1501 Annis Ave Mattoon, IL 61938
Estimated Value: $196,618 - $255,000
3
Beds
2
Baths
1,689
Sq Ft
$134/Sq Ft
Est. Value
About This Home
This home is located at 1501 Annis Ave, Mattoon, IL 61938 and is currently estimated at $226,155, approximately $133 per square foot. 1501 Annis Ave is a home located in Coles County with nearby schools including Mattoon High School and St Mary School.
Ownership History
Date
Name
Owned For
Owner Type
Purchase Details
Closed on
Sep 20, 2019
Sold by
Adams Trust
Bought by
Bales Charles David and Bales Misty
Current Estimated Value
Home Financials for this Owner
Home Financials are based on the most recent Mortgage that was taken out on this home.
Original Mortgage
$149,281
Outstanding Balance
$130,134
Interest Rate
3.37%
Mortgage Type
FHA
Estimated Equity
$96,021
Purchase Details
Closed on
May 14, 2015
Sold by
Gass Julie C
Bought by
Adams Trust
Purchase Details
Closed on
Aug 30, 2012
Sold by
Gass Michael D and Gass Julie C
Bought by
Gass Julie C
Home Financials for this Owner
Home Financials are based on the most recent Mortgage that was taken out on this home.
Original Mortgage
$80,302
Interest Rate
3.48%
Mortgage Type
New Conventional
Purchase Details
Closed on
Dec 10, 2009
Sold by
Goken Ruby and Goken Herschel
Bought by
Gass Michael D and Gass Julie C
Home Financials for this Owner
Home Financials are based on the most recent Mortgage that was taken out on this home.
Original Mortgage
$132,653
Interest Rate
5.11%
Mortgage Type
New Conventional
Create a Home Valuation Report for This Property
The Home Valuation Report is an in-depth analysis detailing your home's value as well as a comparison with similar homes in the area
Home Values in the Area
Average Home Value in this Area
Purchase History
| Date | Buyer | Sale Price | Title Company |
|---|---|---|---|
| Bales Charles David | $152,500 | None Available | |
| Adams Trust | $145,000 | -- | |
| Gass Julie C | -- | None Available | |
| Gass Michael D | $130,000 | None Available |
Source: Public Records
Mortgage History
| Date | Status | Borrower | Loan Amount |
|---|---|---|---|
| Open | Bales Charles David | $149,281 | |
| Previous Owner | Gass Julie C | $80,302 | |
| Previous Owner | Gass Michael D | $132,653 |
Source: Public Records
Tax History
| Year | Tax Paid | Tax Assessment Tax Assessment Total Assessment is a certain percentage of the fair market value that is determined by local assessors to be the total taxable value of land and additions on the property. | Land | Improvement |
|---|---|---|---|---|
| 2024 | $4,917 | $57,860 | $10,074 | $47,786 |
| 2023 | $4,444 | $51,661 | $8,995 | $42,666 |
| 2022 | $4,444 | $50,807 | $8,846 | $41,961 |
| 2021 | $4,456 | $46,667 | $13,864 | $32,803 |
| 2020 | $4,409 | $48,351 | $14,364 | $33,987 |
| 2019 | $4,339 | $46,667 | $13,864 | $32,803 |
| 2018 | $4,265 | $46,667 | $13,864 | $32,803 |
| 2017 | $4,251 | $46,667 | $13,864 | $32,803 |
| 2016 | $4,164 | $46,667 | $13,864 | $32,803 |
| 2015 | $3,920 | $46,667 | $13,864 | $32,803 |
| 2014 | $3,920 | $50,453 | $13,864 | $36,589 |
| 2013 | $3,920 | $50,453 | $13,864 | $36,589 |
Source: Public Records
Map
Nearby Homes
- 1017 S 14th St
- 632 Woodlawn Ave
- LOT 37 Broadmoor Edgewater
- 521 S 17th St
- 1012 S 6th St
- 1312 Edgar Ave
- 705 Marion Ave
- 309 Essex Ave
- 1509 Lafayette Ave
- 716 S 24th St
- 1301 Lafayette Ave
- 720 S 25th St
- 1101 Wabash Ave
- 1001 Wabash Ave
- 2221 Charleston Ave
- 3112 Oak Ave
- 2505 Pine Ave
- 2502 Pine Ave
- 1612 Richmond Ave
- 113 S 25th St
- 1509 Annis Ave
- 1425 Annis Ave
- 1500 Stinson Ave
- 1508 Stinson Ave
- 1500 Annis Ave
- 1424 Stinson Ave
- 1517 Annis Ave
- 1508 Annis Ave
- 1415 Annis Ave
- 1516 Stinson Ave
- 1424 Annis Ave
- 1416 Stinson Ave
- 1516 Annis Ave
- 1501 Stinson Ave
- 1411 Annis Ave
- 1416 Annis Ave
- 1524 Stinson Ave
- 1525 Annis Ave
- 1505 Stinson Ave
- 1507 Bell Ave
Your Personal Tour Guide
Ask me questions while you tour the home.