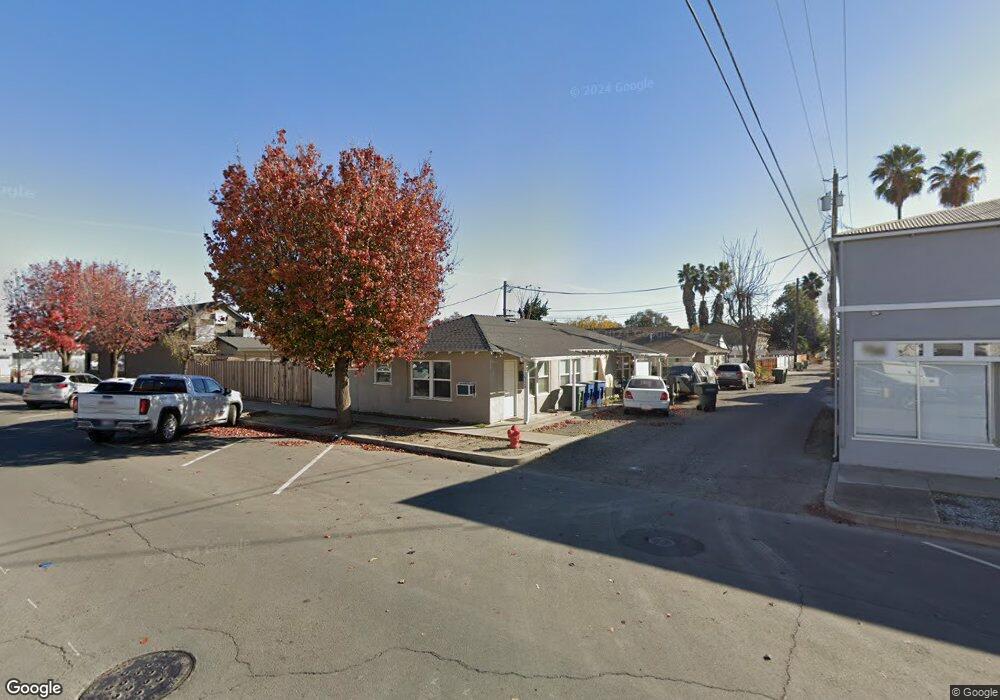
1501 Main St Newman, CA 95360
2
Beds
2
Baths
--
Sq Ft
7,405
Sq Ft
About This Home
This home is located at 1501 Main St, Newman, CA 95360. 1501 Main St is a home located in Stanislaus County with nearby schools including Orestimba High School.
Ownership History
Date
Name
Owned For
Owner Type
Purchase Details
Closed on
Mar 30, 2011
Sold by
Patel Nisha
Bought by
Thakkar Real Estate Investments Llc
Purchase Details
Closed on
Mar 22, 2011
Sold by
I B Property Holdings Llc
Bought by
Patel Nisha
Purchase Details
Closed on
Apr 3, 2009
Sold by
Martin Carlos
Bought by
Ib Property Holdings Llc
Purchase Details
Closed on
May 31, 2005
Sold by
Hickman Gordon E
Bought by
Martin Carlos and Martin Librada
Home Financials for this Owner
Home Financials are based on the most recent Mortgage that was taken out on this home.
Original Mortgage
$524,000
Interest Rate
5.72%
Mortgage Type
Seller Take Back
Create a Home Valuation Report for This Property
The Home Valuation Report is an in-depth analysis detailing your home's value as well as a comparison with similar homes in the area
Home Values in the Area
Average Home Value in this Area
Purchase History
| Date | Buyer | Sale Price | Title Company |
|---|---|---|---|
| Thakkar Real Estate Investments Llc | $150,000 | None Available | |
| Patel Nisha | $150,000 | North American Title Company | |
| Ib Property Holdings Llc | $557,243 | None Available | |
| Martin Carlos | $699,000 | Stewart Title Of Modesto |
Source: Public Records
Mortgage History
| Date | Status | Borrower | Loan Amount |
|---|---|---|---|
| Previous Owner | Martin Carlos | $524,000 |
Source: Public Records
Tax History
| Year | Tax Paid | Tax Assessment Tax Assessment Total Assessment is a certain percentage of the fair market value that is determined by local assessors to be the total taxable value of land and additions on the property. | Land | Improvement |
|---|---|---|---|---|
| 2025 | $1,690 | $137,071 | $35,868 | $101,203 |
| 2024 | $1,650 | $134,384 | $35,165 | $99,219 |
| 2023 | $1,607 | $131,750 | $34,476 | $97,274 |
| 2022 | $1,583 | $129,167 | $33,800 | $95,367 |
| 2021 | $1,560 | $126,636 | $33,138 | $93,498 |
| 2020 | $1,531 | $125,339 | $32,799 | $92,540 |
| 2019 | $1,069 | $82,686 | $32,156 | $50,530 |
| 2018 | $1,004 | $81,066 | $31,526 | $49,540 |
| 2017 | $1,086 | $79,477 | $30,908 | $48,569 |
| 2016 | $971 | $77,919 | $30,302 | $47,617 |
| 2015 | $998 | $76,749 | $29,847 | $46,902 |
| 2014 | $990 | $75,247 | $29,263 | $45,984 |
Source: Public Records
Map
Nearby Homes
Your Personal Tour Guide
Ask me questions while you tour the home.