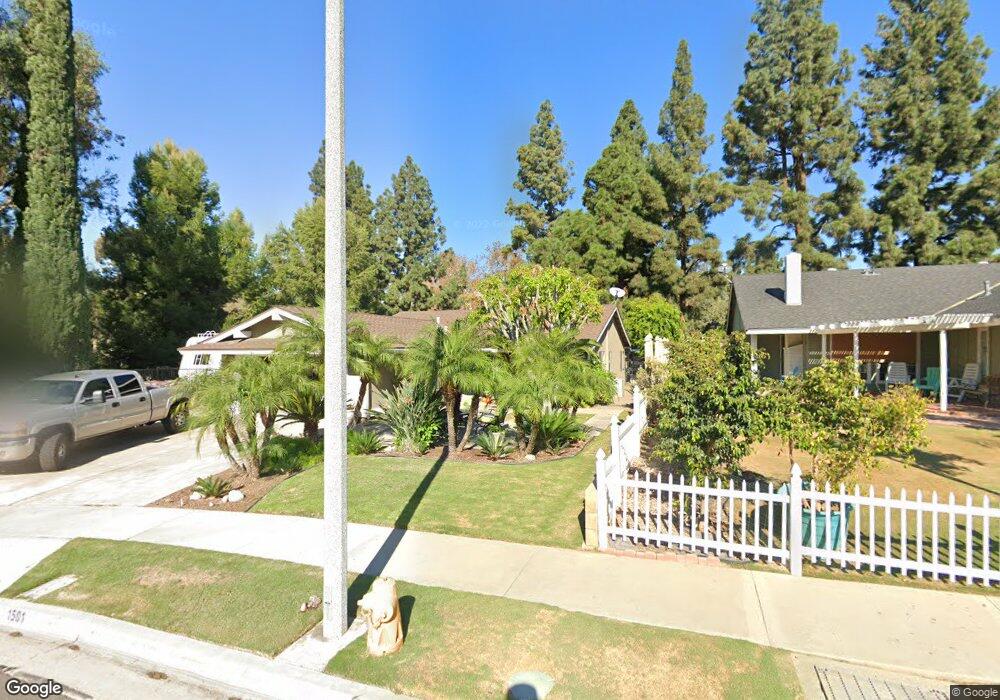
1501 Mammoth Cir Placentia, CA 92870
Estimated Value: $959,000 - $1,139,000
4
Beds
2
Baths
1,440
Sq Ft
$733/Sq Ft
Est. Value
About This Home
This home is located at 1501 Mammoth Cir, Placentia, CA 92870 and is currently estimated at $1,055,747, approximately $733 per square foot. 1501 Mammoth Cir is a home located in Orange County with nearby schools including Van Buren Elementary School, Kraemer Middle School, and Valencia High School.
Ownership History
Date
Name
Owned For
Owner Type
Purchase Details
Closed on
Feb 24, 2017
Sold by
Payne Mark S and Payne Carol L
Bought by
Payne Mark S and Payne Carol L
Current Estimated Value
Purchase Details
Closed on
Mar 21, 2006
Sold by
Payne Mark and Payne Carol
Bought by
Payne Mark S and Payne Carol L
Home Financials for this Owner
Home Financials are based on the most recent Mortgage that was taken out on this home.
Original Mortgage
$335,000
Outstanding Balance
$190,222
Interest Rate
6.25%
Mortgage Type
New Conventional
Estimated Equity
$865,525
Purchase Details
Closed on
Mar 18, 2002
Sold by
Barnes Gerald D
Bought by
Payne Mark and Payne Carol
Purchase Details
Closed on
Apr 19, 1999
Sold by
Jeanne Beking Beverly
Bought by
Barnes Gerald D
Create a Home Valuation Report for This Property
The Home Valuation Report is an in-depth analysis detailing your home's value as well as a comparison with similar homes in the area
Home Values in the Area
Average Home Value in this Area
Purchase History
| Date | Buyer | Sale Price | Title Company |
|---|---|---|---|
| Payne Mark S | -- | None Available | |
| Payne Mark S | -- | First American Title Co | |
| Payne Mark | -- | Fidelity National Title Ins | |
| Barnes Gerald D | $250,000 | Fidelity National Title Co |
Source: Public Records
Mortgage History
| Date | Status | Borrower | Loan Amount |
|---|---|---|---|
| Open | Payne Mark S | $335,000 |
Source: Public Records
Tax History
| Year | Tax Paid | Tax Assessment Tax Assessment Total Assessment is a certain percentage of the fair market value that is determined by local assessors to be the total taxable value of land and additions on the property. | Land | Improvement |
|---|---|---|---|---|
| 2025 | $5,098 | $398,861 | $290,138 | $108,723 |
| 2024 | $5,098 | $391,041 | $284,449 | $106,592 |
| 2023 | $4,969 | $383,374 | $278,872 | $104,502 |
| 2022 | $4,868 | $375,857 | $273,404 | $102,453 |
| 2021 | $4,729 | $368,488 | $268,043 | $100,445 |
| 2020 | $4,628 | $364,710 | $265,294 | $99,416 |
| 2019 | $4,437 | $357,559 | $260,092 | $97,467 |
| 2018 | $4,377 | $350,549 | $254,993 | $95,556 |
| 2017 | $4,301 | $343,676 | $249,993 | $93,683 |
| 2016 | $4,215 | $336,938 | $245,091 | $91,847 |
| 2015 | $4,158 | $331,877 | $241,409 | $90,468 |
| 2014 | $4,042 | $325,376 | $236,680 | $88,696 |
Source: Public Records
Map
Nearby Homes
- 1248 Carlsbad St
- 5301 Raintree St
- 1355 Montevideo Ave
- 17530 Monette Cir
- 1527 E Evans Ln
- 17751 Buena Vista Ave
- 1509 Prospect Ave Unit D
- 642 Patten Ave
- 1232 Woodside Dr
- 635 Patten Ave
- 623 Patten Ave
- 17271 Orange Dr
- 607 Patten Ave
- 617 Patten Ave
- 581 Patten Ave
- 17541 Pine Cir
- 603 Patten Ave
- 605 Patten Ave
- 17752 Ridgecrest Dr
- 5141 Siesta Ln
- 1507 Mammoth Cir
- 1513 Mammoth Cir
- 17111 Cumberland Cir
- 1512 Yellowstone Ave
- 1500 Mammoth Cir
- 1506 Mammoth Cir
- 17101 Cumberland Cir
- 1519 Mammoth Cir
- 1518 Yellowstone Ave
- 1019 Mammoth Way
- 17091 Cumberland Cir
- 1511 Yellowstone Ave
- 17100 Cumberland Cir
- 1524 Yellowstone Ave
- 1013 Mammoth Way
- 5358 Saratoga St
- 1161 Yosemite Dr
- 1155 Yosemite Dr
- 1018 Mammoth Way
Your Personal Tour Guide
Ask me questions while you tour the home.