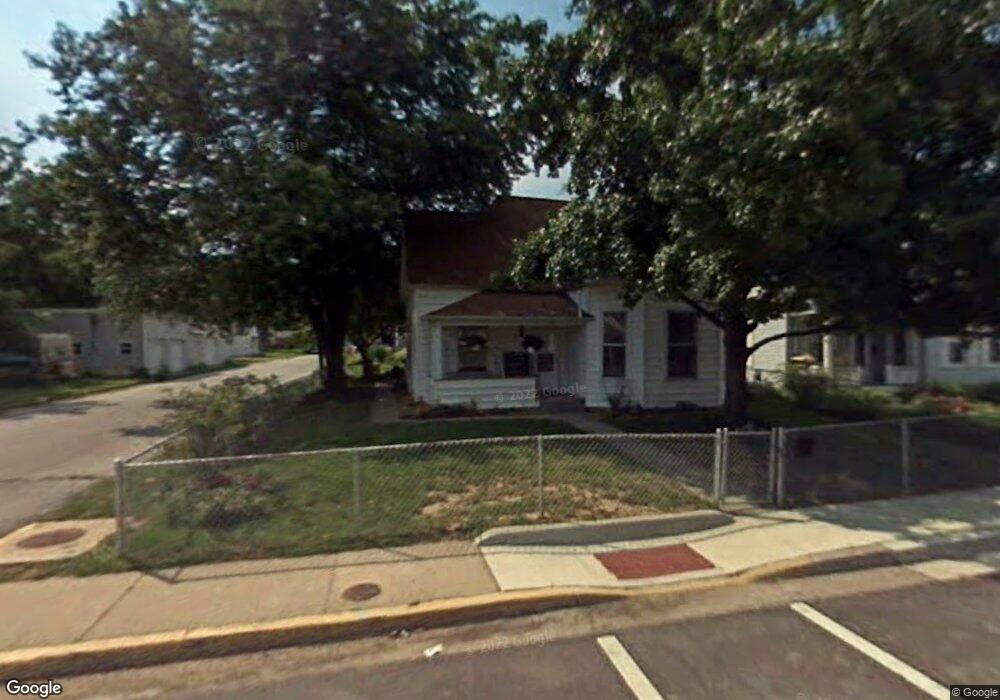
1501 N 3rd St Saint Charles, MO 63301
Old Town Saint Charles NeighborhoodEstimated Value: $209,000 - $261,000
3
Beds
1
Bath
1,330
Sq Ft
$178/Sq Ft
Est. Value
About This Home
This home is located at 1501 N 3rd St, Saint Charles, MO 63301 and is currently estimated at $236,503, approximately $177 per square foot. 1501 N 3rd St is a home located in St. Charles County with nearby schools including Coverdell Elementary School, Hardin Middle School, and Jefferson Intermediate School.
Ownership History
Date
Name
Owned For
Owner Type
Purchase Details
Closed on
Nov 17, 2004
Sold by
Buek Stephen R and Buek Mary C
Bought by
Kyle Christopher T
Current Estimated Value
Home Financials for this Owner
Home Financials are based on the most recent Mortgage that was taken out on this home.
Original Mortgage
$79,200
Outstanding Balance
$40,101
Interest Rate
6%
Mortgage Type
Purchase Money Mortgage
Estimated Equity
$196,402
Purchase Details
Closed on
Jun 21, 2002
Sold by
Gonzales Werner M and Lawson Michele
Bought by
Buek Stephen R and Buek Mary C
Home Financials for this Owner
Home Financials are based on the most recent Mortgage that was taken out on this home.
Original Mortgage
$93,575
Interest Rate
5.62%
Purchase Details
Closed on
Jul 20, 1999
Sold by
Stone William and Estate Of Bertha M Stone
Bought by
Gonzales Werner M
Home Financials for this Owner
Home Financials are based on the most recent Mortgage that was taken out on this home.
Original Mortgage
$42,750
Interest Rate
7.63%
Create a Home Valuation Report for This Property
The Home Valuation Report is an in-depth analysis detailing your home's value as well as a comparison with similar homes in the area
Home Values in the Area
Average Home Value in this Area
Purchase History
| Date | Buyer | Sale Price | Title Company |
|---|---|---|---|
| Kyle Christopher T | $99,000 | Ust | |
| Buek Stephen R | -- | -- | |
| Gonzales Werner M | $45,000 | -- |
Source: Public Records
Mortgage History
| Date | Status | Borrower | Loan Amount |
|---|---|---|---|
| Open | Kyle Christopher T | $79,200 | |
| Previous Owner | Buek Stephen R | $93,575 | |
| Previous Owner | Gonzales Werner M | $42,750 | |
| Closed | Kyle Christopher T | $19,800 |
Source: Public Records
Tax History Compared to Growth
Tax History
| Year | Tax Paid | Tax Assessment Tax Assessment Total Assessment is a certain percentage of the fair market value that is determined by local assessors to be the total taxable value of land and additions on the property. | Land | Improvement |
|---|---|---|---|---|
| 2025 | $1,988 | $27,126 | -- | -- |
| 2023 | $1,985 | $30,776 | $0 | $0 |
| 2022 | $1,655 | $23,863 | $0 | $0 |
| 2021 | $1,657 | $23,863 | $0 | $0 |
| 2020 | $1,532 | $21,182 | $0 | $0 |
| 2019 | $1,519 | $21,182 | $0 | $0 |
| 2018 | $1,517 | $20,123 | $0 | $0 |
| 2017 | $1,497 | $20,123 | $0 | $0 |
| 2016 | $1,483 | $19,212 | $0 | $0 |
| 2015 | $1,481 | $19,212 | $0 | $0 |
| 2014 | $1,444 | $18,478 | $0 | $0 |
Source: Public Records
Map
Nearby Homes
- 1303 N 3rd St
- 1107 N 2nd St
- 929 N 3rd St Unit 3
- 2031 N 5th St
- 2101 N 4th St
- 800 N 4th St
- 1718 Gallaher Ave
- 705 N Benton Ave
- 918 Lindenwood Ave
- 630 N 6th St
- 553 Lewis St
- 2228 Cherry Ln
- 332 N 6th St
- 2300 de La Croix Ave
- 215 N 4th St
- 816 Adams St
- 57 Saint Francis Ln
- 128 N 6th St
- 407 Houston St
- 2309 Park Ave