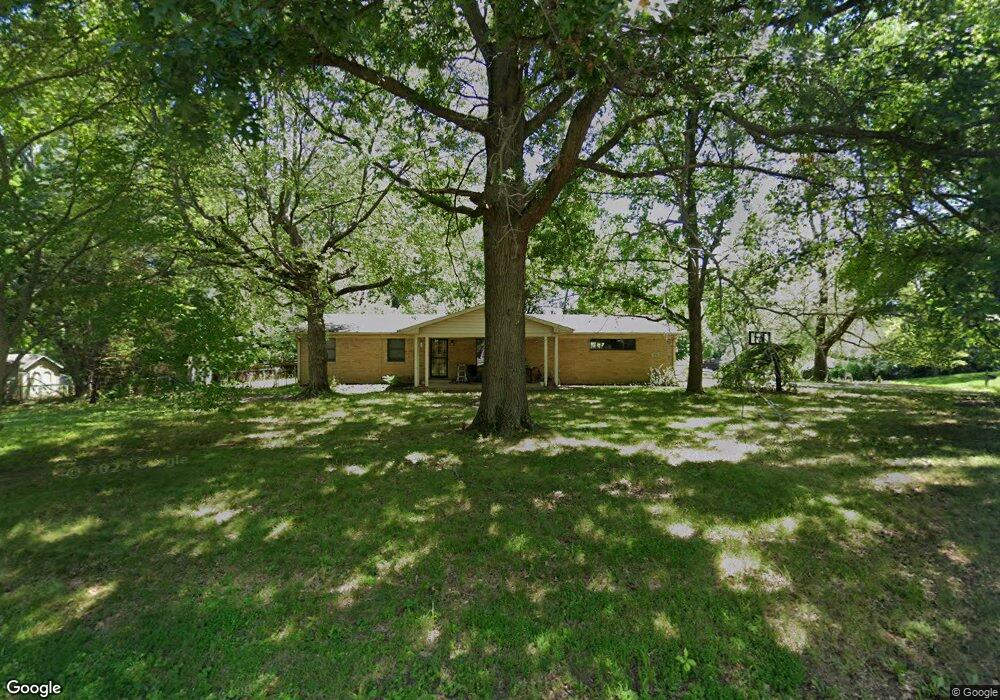
1501 N Furman Ave Indianapolis, IN 46214
Chapel Hill-Ben Davis NeighborhoodEstimated Value: $219,000 - $292,000
3
Beds
2
Baths
2,484
Sq Ft
$100/Sq Ft
Est. Value
About This Home
This home is located at 1501 N Furman Ave, Indianapolis, IN 46214 and is currently estimated at $247,577, approximately $99 per square foot. 1501 N Furman Ave is a home located in Marion County with nearby schools including Chapelwood Elementary School, Chapel Hill 7th & 8th Grade Center, and Ben Davis Ninth Grade Center.
Ownership History
Date
Name
Owned For
Owner Type
Purchase Details
Closed on
Jul 18, 2022
Sold by
Red Diamond Property Solutions Llc
Bought by
5D Investments Llc
Current Estimated Value
Home Financials for this Owner
Home Financials are based on the most recent Mortgage that was taken out on this home.
Original Mortgage
$162,750
Outstanding Balance
$154,612
Interest Rate
5.09%
Mortgage Type
New Conventional
Estimated Equity
$92,965
Purchase Details
Closed on
Jan 28, 2022
Sold by
Dancy Angela M
Bought by
Red Diamond Property Solutions Llc
Purchase Details
Closed on
Sep 19, 2006
Sold by
Cook Deborah and Estate Of Jean Kennard
Bought by
Dancy Angela M
Home Financials for this Owner
Home Financials are based on the most recent Mortgage that was taken out on this home.
Original Mortgage
$122,970
Interest Rate
6.59%
Mortgage Type
FHA
Purchase Details
Closed on
Sep 11, 2006
Sold by
Cook Deborah and Estate Of Jean Kennard
Bought by
Dancy Angela M
Home Financials for this Owner
Home Financials are based on the most recent Mortgage that was taken out on this home.
Original Mortgage
$122,970
Interest Rate
6.59%
Mortgage Type
FHA
Create a Home Valuation Report for This Property
The Home Valuation Report is an in-depth analysis detailing your home's value as well as a comparison with similar homes in the area
Home Values in the Area
Average Home Value in this Area
Purchase History
| Date | Buyer | Sale Price | Title Company |
|---|---|---|---|
| 5D Investments Llc | -- | Indiana Home Title | |
| Red Diamond Property Solutions Llc | -- | None Listed On Document | |
| Dancy Angela M | -- | None Available | |
| Dancy Angela M | -- | None Available |
Source: Public Records
Mortgage History
| Date | Status | Borrower | Loan Amount |
|---|---|---|---|
| Open | 5D Investments Llc | $162,750 | |
| Previous Owner | Dancy Angela M | $122,970 | |
| Previous Owner | Dancy Angela M | $122,970 |
Source: Public Records
Tax History Compared to Growth
Tax History
| Year | Tax Paid | Tax Assessment Tax Assessment Total Assessment is a certain percentage of the fair market value that is determined by local assessors to be the total taxable value of land and additions on the property. | Land | Improvement |
|---|---|---|---|---|
| 2024 | $5,644 | $206,000 | $20,200 | $185,800 |
| 2023 | $5,644 | $201,500 | $20,200 | $181,300 |
| 2022 | $5,295 | $193,300 | $20,200 | $173,100 |
| 2021 | $4,291 | $149,000 | $20,200 | $128,800 |
| 2020 | $4,393 | $152,500 | $20,200 | $132,300 |
| 2019 | $3,648 | $135,000 | $20,200 | $114,800 |
| 2018 | $3,478 | $128,000 | $20,200 | $107,800 |
| 2017 | $2,796 | $116,600 | $20,200 | $96,400 |
| 2016 | $2,588 | $114,900 | $20,200 | $94,700 |
| 2014 | $2,079 | $103,800 | $20,200 | $83,600 |
| 2013 | $832 | $100,500 | $20,200 | $80,300 |
Source: Public Records
Map
Nearby Homes
- 6785 W 14th St
- 7045 Buick Dr
- 6731 W 16th St
- 1254 Topp Creek Dr
- 7009 Thousand Oaks Ln
- 6605 W 12th St
- 6913 Thousand Oaks Dr
- 6911 W 10th St
- 6567 Santa Ana Ln
- 6932 Lohr Way
- 848 Prescott Ct
- 2104 Napa Cir
- 7206 Halden Place
- 636 Chapel Hill Rd
- 2321 Gradison Cir
- 2326 Gradison Cir
- 7515 W Saint Clair St
- 7506 Radburn Cir
- 6904 W Lockerbie Dr
- 6911 W Lockerbie Dr
- 6942 W 15th St
- 1545 N Furman Ave
- 6945 W 16th St
- 6934 W 15th St
- 6937 W 16th St
- 6943 W 15th St
- 1518 N Furman Ave
- 1546 N Furman Ave
- 1502 N Furman Ave
- 1550 N Furman Ave
- 6929 W 16th St
- 6926 W 15th St
- 1492 N Furman Ave
- 1483 N Furman Ave
- 1534 N Furman Ave
- 6921 W 16th St
- 6941 W 15th St
- 1486 N Furman Ave
- 6918 W 15th St
- 1603 N Furman Ave