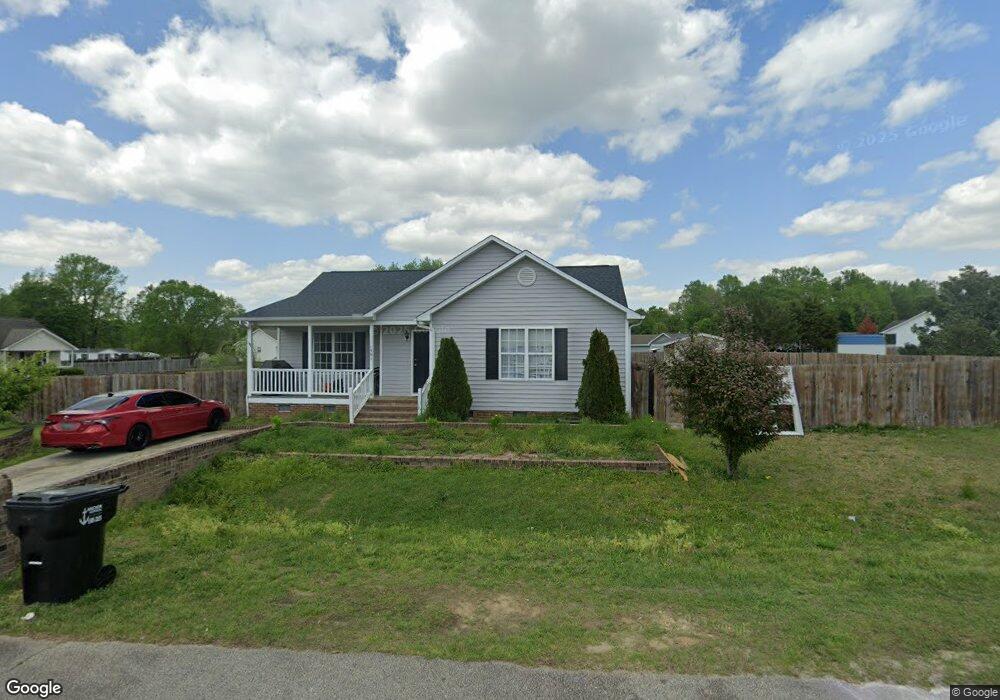
1501 Porchlight Ct Raleigh, NC 27603
Estimated Value: $261,000 - $310,080
3
Beds
2
Baths
1,223
Sq Ft
$231/Sq Ft
Est. Value
About This Home
This home is located at 1501 Porchlight Ct, Raleigh, NC 27603 and is currently estimated at $282,270, approximately $230 per square foot. 1501 Porchlight Ct is a home located in Wake County with nearby schools including Rand Road Elementary, North Garner Middle, and South Garner High.
Ownership History
Date
Name
Owned For
Owner Type
Purchase Details
Closed on
Jun 14, 2016
Sold by
Green Hill Rentals Llc
Bought by
Dela O Naudelia Rodriguez and Guerrero Miguel Angle
Current Estimated Value
Purchase Details
Closed on
Sep 18, 2014
Sold by
Deal Johnny E and Deal Karen M
Bought by
Green Hill Rentals Llc
Purchase Details
Closed on
Sep 8, 2014
Sold by
Federal Home Loan Mortgage Corporation
Bought by
Deal Johnny E
Purchase Details
Closed on
Feb 28, 2014
Sold by
Alcocer Jose Luis and Alcocer Blanca
Bought by
Federal Home Loan Mortgage Corporation
Purchase Details
Closed on
Oct 31, 2000
Sold by
Southeast Custom Homes Inc
Bought by
Alcocer Jose Luis and Alcocer Blanca
Home Financials for this Owner
Home Financials are based on the most recent Mortgage that was taken out on this home.
Original Mortgage
$109,900
Interest Rate
7.94%
Create a Home Valuation Report for This Property
The Home Valuation Report is an in-depth analysis detailing your home's value as well as a comparison with similar homes in the area
Home Values in the Area
Average Home Value in this Area
Purchase History
| Date | Buyer | Sale Price | Title Company |
|---|---|---|---|
| Dela O Naudelia Rodriguez | $123,500 | None Available | |
| Green Hill Rentals Llc | -- | None Available | |
| Deal Johnny E | -- | Chicago Title Insurance Co | |
| Federal Home Loan Mortgage Corporation | $109,000 | None Available | |
| Alcocer Jose Luis | $110,000 | -- |
Source: Public Records
Mortgage History
| Date | Status | Borrower | Loan Amount |
|---|---|---|---|
| Previous Owner | Alcocer Jose Luis | $109,900 |
Source: Public Records
Tax History Compared to Growth
Tax History
| Year | Tax Paid | Tax Assessment Tax Assessment Total Assessment is a certain percentage of the fair market value that is determined by local assessors to be the total taxable value of land and additions on the property. | Land | Improvement |
|---|---|---|---|---|
| 2025 | $1,706 | $263,575 | $95,000 | $168,575 |
| 2024 | $1,657 | $263,575 | $95,000 | $168,575 |
| 2023 | $1,256 | $158,494 | $28,000 | $130,494 |
| 2022 | $1,165 | $158,494 | $28,000 | $130,494 |
| 2021 | $1,134 | $158,494 | $28,000 | $130,494 |
| 2020 | $1,115 | $158,494 | $28,000 | $130,494 |
| 2019 | $966 | $115,799 | $26,000 | $89,799 |
| 2018 | $889 | $115,799 | $26,000 | $89,799 |
| 2017 | $843 | $115,799 | $26,000 | $89,799 |
| 2016 | $827 | $115,799 | $26,000 | $89,799 |
| 2015 | -- | $124,645 | $34,000 | $90,645 |
| 2014 | -- | $124,645 | $34,000 | $90,645 |
Source: Public Records
Map
Nearby Homes
- 1009 Feldmen Dr
- 1101 Robinfield Dr
- 449 Kings Hollow Dr
- 5013 Contender Dr
- 1005 Turner Meadow Dr
- 10001 Joe Leach Rd
- 6009 Swales Way
- 1220 Turner Woods Dr
- 1021 Wintu Ct
- 1559 Upchurch Woods Dr
- 2704 Stageline Dr
- 2600 Banks Rd Unit Lot 2
- 2600 Banks Rd Unit Lot 1
- 9017 Hunterfox Ct
- 1233 Azalea Garden Cir
- 1017 Azalea Garden Cir
- 6121 Catandpolly Ln
- 1025 Azalea Garden Cir
- 2400 Trueway Ln
- 1017 Widgeon Way
- 1505 Porchlight Ct
- 1300 Mooreland Ct
- 1509 Porchlight Ct
- 5712 Holland Farms Way
- 5708 Holland Farms Way
- 1500 Porchlight Ct
- 1304 Mooreland Ct
- 1504 Porchlight Ct
- 1401 Porchlight Ct
- 1508 Porchlight Ct
- 5704 Holland Farms Way
- 5805 Holland Farms Way
- 1404 Porchlight Ct
- 1309 Mooreland Ct
- 1205 Harvey Johnson Rd
- 5701 Holland Farms Way
- 1205 Blue Moon Ct
- 1223 Harvey Johnson Rd
- 1100 Danesfield Ct
- 1409 Porchlight Ct