Estimated Value: $498,000 - $518,462
3
Beds
3
Baths
1,762
Sq Ft
$289/Sq Ft
Est. Value
About This Home
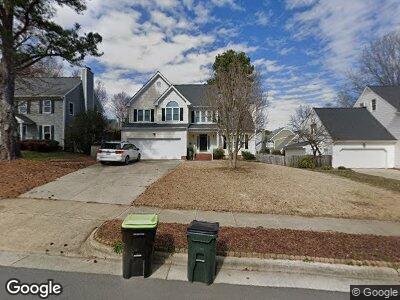
This home is located at 1501 Rainesview Ln, Apex, NC 27502 and is currently estimated at $509,866, approximately $289 per square foot. 1501 Rainesview Ln is a home located in Wake County with nearby schools including Apex Elementary, Apex Middle, and Apex High School.
Ownership History
Date
Name
Owned For
Owner Type
Purchase Details
Closed on
Jul 28, 2016
Sold by
Beahm Christopher M and Beahm Melissa B
Bought by
Bullock Michelle N and Bullock Landon S
Current Estimated Value
Home Financials for this Owner
Home Financials are based on the most recent Mortgage that was taken out on this home.
Original Mortgage
$260,200
Interest Rate
3.62%
Mortgage Type
FHA
Purchase Details
Closed on
Apr 15, 2004
Sold by
Purcell Michael E
Bought by
Beahm Christopher M and Beahm Melissa B
Home Financials for this Owner
Home Financials are based on the most recent Mortgage that was taken out on this home.
Original Mortgage
$146,400
Interest Rate
5.54%
Mortgage Type
Purchase Money Mortgage
Purchase Details
Closed on
Apr 30, 1998
Sold by
Edwards James Marcus and Hagopian Edwards Judy
Bought by
Purcell Michael E
Home Financials for this Owner
Home Financials are based on the most recent Mortgage that was taken out on this home.
Original Mortgage
$144,000
Interest Rate
7.03%
Create a Home Valuation Report for This Property
The Home Valuation Report is an in-depth analysis detailing your home's value as well as a comparison with similar homes in the area
Home Values in the Area
Average Home Value in this Area
Purchase History
| Date | Buyer | Sale Price | Title Company |
|---|---|---|---|
| Bullock Michelle N | $265,000 | None Available | |
| Beahm Christopher M | $183,000 | -- | |
| Purcell Michael E | $160,000 | -- |
Source: Public Records
Mortgage History
| Date | Status | Borrower | Loan Amount |
|---|---|---|---|
| Open | Bullock Michelle N | $32,700 | |
| Open | Bullock Landon Seth | $245,900 | |
| Closed | Bullock Michelle N | $260,200 | |
| Previous Owner | Beahm Christopher M | $146,400 | |
| Previous Owner | Purcell Michael E | $144,000 |
Source: Public Records
Tax History Compared to Growth
Tax History
| Year | Tax Paid | Tax Assessment Tax Assessment Total Assessment is a certain percentage of the fair market value that is determined by local assessors to be the total taxable value of land and additions on the property. | Land | Improvement |
|---|---|---|---|---|
| 2024 | $4,196 | $489,308 | $190,000 | $299,308 |
| 2023 | $3,368 | $305,233 | $75,000 | $230,233 |
| 2022 | $3,075 | $296,700 | $75,000 | $221,700 |
| 2021 | $2,957 | $296,700 | $75,000 | $221,700 |
| 2020 | $2,928 | $296,700 | $75,000 | $221,700 |
| 2019 | $2,754 | $240,701 | $75,000 | $165,701 |
| 2018 | $2,594 | $240,701 | $75,000 | $165,701 |
| 2017 | $2,415 | $240,701 | $75,000 | $165,701 |
| 2016 | $2,380 | $240,701 | $75,000 | $165,701 |
| 2015 | $2,347 | $231,622 | $64,000 | $167,622 |
| 2014 | $2,262 | $231,622 | $64,000 | $167,622 |
Source: Public Records
Map
Nearby Homes
- 501 Samara St
- 1612 Rainesview Ln
- 112 Briarfield Dr
- 801 Myrtle Grove Ln
- 1005 Thorncroft Ln
- 140 Heatherwood Dr
- 115 Heatherwood Dr
- 2316 Apex Peakway
- 635 Sawcut Ln
- 633 Sawcut Ln
- 631 Sawcut Ln
- 231 Grindstone Dr
- 309 Old Mill Village Dr
- 2006 Chedington Dr
- 1007 Wellstone Cir
- 1007 Surry Dale Ct
- 1013 New Chester Ct
- 2013 Waterton Ln
- 2018 Waterton Ln
- 1113 Smokewood Dr
- 1501 Rainesview Ln
- 1407 Rainesview Ln
- 1503 Rainesview Ln
- 403 Samara St
- 1405 Rainesview Ln
- 500 Thorngate Rd
- 501 Thorngate Rd
- 405 Samara St
- 1502 Rainesview Ln
- 1500 Rainesview Ln
- 1403 Rainesview Ln
- 1504 Rainesview Ln
- 1406 Rainesview Ln
- 400 Samara St
- 503 Thorngate Rd
- 407 Samara St
- 502 Thorngate Rd
- 402 Samara St
- 1506 Rainesview Ln
- 1404 Rainesview Ln