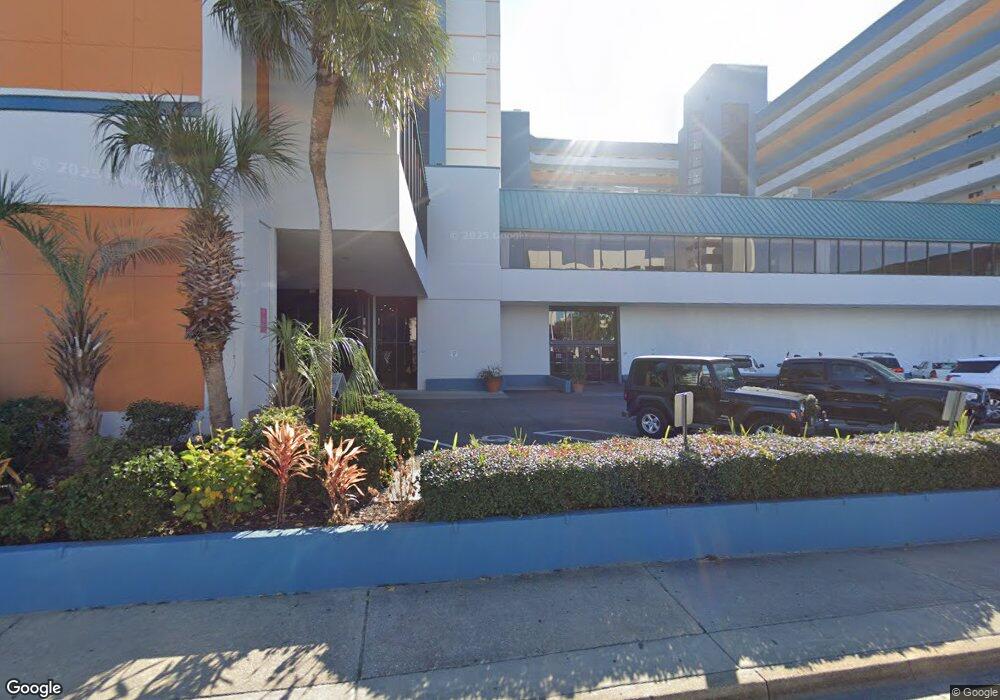
1501 S Ocean Blvd Unit 1230 LANDMARK RESOR Myrtle Beach, SC 29577
Downtown Myrtle Beach Neighborhood
--
Bed
1
Bath
450
Sq Ft
--
Built
About This Home
This home is located at 1501 S Ocean Blvd Unit 1230 LANDMARK RESOR, Myrtle Beach, SC 29577. 1501 S Ocean Blvd Unit 1230 LANDMARK RESOR is a home located in Horry County with nearby schools including Myrtle Beach Child Development Center, Myrtle Beach Primary School, and Myrtle Beach Elementary School.
Create a Home Valuation Report for This Property
The Home Valuation Report is an in-depth analysis detailing your home's value as well as a comparison with similar homes in the area
Home Values in the Area
Average Home Value in this Area
Tax History Compared to Growth
Tax History
| Year | Tax Paid | Tax Assessment Tax Assessment Total Assessment is a certain percentage of the fair market value that is determined by local assessors to be the total taxable value of land and additions on the property. | Land | Improvement |
|---|---|---|---|---|
| 2024 | $1,769 | $6,954 | $0 | $6,954 |
| 2023 | $1,769 | $8,610 | $0 | $8,610 |
| 2021 | $1,329 | $8,610 | $0 | $8,610 |
| 2020 | $1,268 | $8,610 | $0 | $8,610 |
| 2019 | $1,268 | $8,610 | $0 | $8,610 |
| 2018 | $1,149 | $7,560 | $0 | $7,560 |
| 2017 | $884 | $3,360 | $0 | $3,360 |
| 2016 | $0 | $3,360 | $0 | $3,360 |
| 2015 | -- | $5,880 | $0 | $5,880 |
| 2014 | $849 | $3,360 | $0 | $3,360 |
Source: Public Records
Map
Nearby Homes
- 1501 S Ocean Blvd Unit 915
- 1501 S Ocean Blvd Unit 1433
- 1501 S Ocean Blvd Unit 444
- 1501 S Ocean Blvd Unit 338
- 1501 S Ocean Blvd Unit 223
- 1501 S Ocean Blvd Unit 514
- 1501 S Ocean Blvd Unit 1048 Landmark Resor
- 1501 S Ocean Blvd Unit 626
- 1501 S Ocean Blvd Unit 850
- 1501 S Ocean Blvd Unit 1031
- 1501 S Ocean Blvd Unit 1442
- 1501 S Ocean Blvd Unit 839
- 1501 S Ocean Blvd Unit 329
- 1501 S Ocean Blvd Unit 616
- 1501 S Ocean Blvd Unit 511
- 1501 S Ocean Blvd Unit 429
- 1501 S Ocean Blvd Unit 1042
- 1501 S Ocean Blvd Unit 648
- 1501 S Ocean Blvd Unit 239
- 1501 S Ocean Blvd Unit 919
- 1501 S Ocean Blvd Unit 1049
- 1501 S Ocean Blvd Unit 519 LANDMARK
- 1501 S Ocean Blvd Unit 747
- 1501 S Ocean Blvd Unit 628 Landmark Resort
- 1501 S Ocean Blvd Unit 741 LANDMARK R
- 1501 S Ocean Blvd Unit 226 Landmark
- 1501 S Ocean Blvd Unit Landmark
- 1501 S Ocean Blvd Unit Landmark Resort 15
- 1501 S Ocean Blvd Unit 1508 LANDMARK
- 1501 S Ocean Blvd Unit Landmark Resort 123
- 1501 S Ocean Blvd Unit 1412 LANDMARK II
- 1501 S Ocean Blvd Unit 427 LANDMARK
- 1501 S Ocean Blvd Unit 315 Landmark Resort
- 1501 S Ocean Blvd Unit 946 LANDMARK
- 1501 S Ocean Blvd Unit 1046
- 1501 S Ocean Blvd Unit Landmark 1026
- 1501 S Ocean Blvd Unit 619 Landmark Resor
- 1501 S Ocean Blvd Unit 1201 Landmark
- 1501 S Ocean Blvd Unit 1107 LANDMARK RESO
- 1501 S Ocean Blvd Unit 240 LANDMARK RESOR