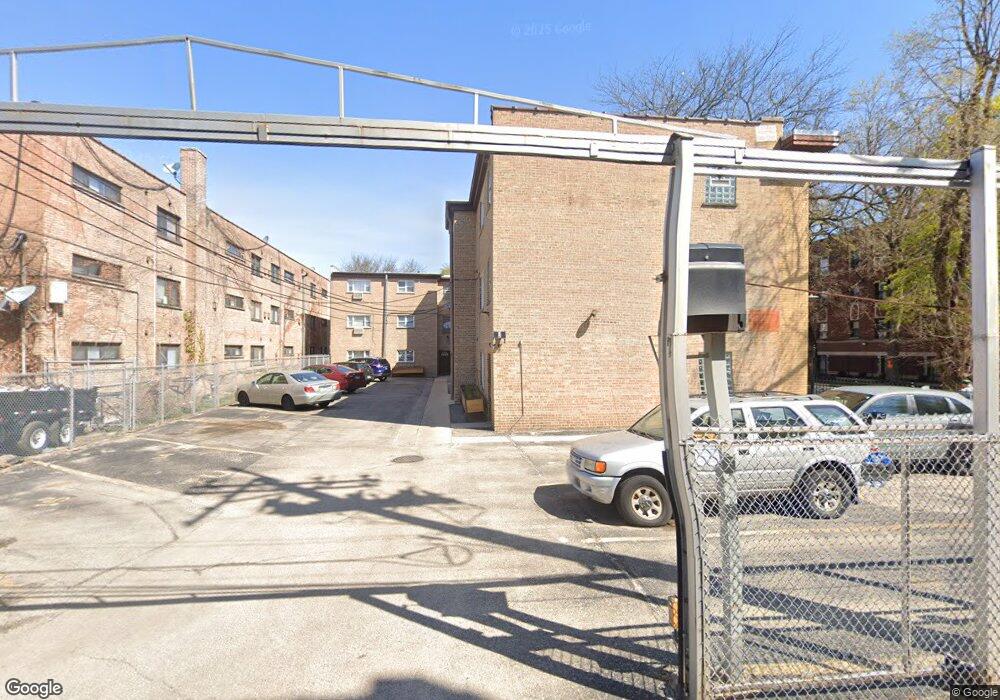
1501 W Farwell Ave Unit 15013E Chicago, IL 60626
Rogers Park NeighborhoodEstimated Value: $185,000 - $202,000
2
Beds
1
Bath
14,631
Sq Ft
$13/Sq Ft
Est. Value
About This Home
This home is located at 1501 W Farwell Ave Unit 15013E, Chicago, IL 60626 and is currently estimated at $193,715, approximately $13 per square foot. 1501 W Farwell Ave Unit 15013E is a home located in Cook County with nearby schools including New Field Elementary School, Eugene Field Elementary School, and Sullivan High School.
Ownership History
Date
Name
Owned For
Owner Type
Purchase Details
Closed on
Jul 21, 2022
Sold by
Minor Jeff T
Bought by
Haile Aldilu
Current Estimated Value
Home Financials for this Owner
Home Financials are based on the most recent Mortgage that was taken out on this home.
Original Mortgage
$120,000
Outstanding Balance
$114,819
Interest Rate
5.78%
Mortgage Type
New Conventional
Estimated Equity
$78,896
Purchase Details
Closed on
May 6, 2005
Sold by
Carbonell Sonia and Jones Natalia
Bought by
Minor Jeff T
Home Financials for this Owner
Home Financials are based on the most recent Mortgage that was taken out on this home.
Original Mortgage
$132,500
Interest Rate
4.9%
Mortgage Type
Unknown
Purchase Details
Closed on
Jun 4, 2002
Sold by
Albany Bank & Trust Company Na
Bought by
Carbonell Sonia and Castro Natalia
Home Financials for this Owner
Home Financials are based on the most recent Mortgage that was taken out on this home.
Original Mortgage
$110,400
Interest Rate
6.41%
Create a Home Valuation Report for This Property
The Home Valuation Report is an in-depth analysis detailing your home's value as well as a comparison with similar homes in the area
Home Values in the Area
Average Home Value in this Area
Purchase History
| Date | Buyer | Sale Price | Title Company |
|---|---|---|---|
| Haile Aldilu | $150,000 | Chicago Title | |
| Minor Jeff T | $166,000 | Pntn | |
| Carbonell Sonia | $147,500 | -- |
Source: Public Records
Mortgage History
| Date | Status | Borrower | Loan Amount |
|---|---|---|---|
| Open | Haile Aldilu | $120,000 | |
| Previous Owner | Minor Jeff T | $132,500 | |
| Previous Owner | Carbonell Sonia | $110,400 |
Source: Public Records
Tax History Compared to Growth
Tax History
| Year | Tax Paid | Tax Assessment Tax Assessment Total Assessment is a certain percentage of the fair market value that is determined by local assessors to be the total taxable value of land and additions on the property. | Land | Improvement |
|---|---|---|---|---|
| 2024 | $2,766 | $15,736 | $1,784 | $13,952 |
| 2023 | $2,696 | $13,108 | $1,427 | $11,681 |
| 2022 | $2,696 | $13,108 | $1,427 | $11,681 |
| 2021 | $2,636 | $13,108 | $1,427 | $11,681 |
| 2020 | $2,606 | $11,696 | $1,149 | $10,547 |
| 2019 | $2,620 | $13,038 | $1,149 | $11,889 |
| 2018 | $2,575 | $13,038 | $1,149 | $11,889 |
| 2017 | $2,512 | $11,667 | $1,030 | $10,637 |
| 2016 | $2,337 | $11,667 | $1,030 | $10,637 |
| 2015 | $2,138 | $11,667 | $1,030 | $10,637 |
| 2014 | $1,539 | $8,294 | $951 | $7,343 |
| 2013 | $1,508 | $8,294 | $951 | $7,343 |
Source: Public Records
Map
Nearby Homes
- 1415 W Lunt Ave Unit 207
- 1411 W Farwell Ave Unit E2
- 1515 W Pratt Blvd Unit 1
- 6818 N Ashland Blvd Unit 1A
- 7021 N Greenview Ave Unit G
- 1339 W Lunt Ave Unit 2N
- 1634 W Morse Ave Unit C
- 1634 W Morse Ave
- 6737 N Greenview Ave Unit 2S
- 1643 W Farwell Ave Unit 3N
- 1658 W Farwell Ave Unit GC
- 1657 W Farwell Ave Unit 1D
- 1629 W Greenleaf Ave Unit 407
- 1645 W Greenleaf Ave Unit 3E
- 6712 N Glenwood Ave Unit 2
- 1225 W Lunt Ave Unit 12252B
- 1535 W Estes Ave
- 1535 W Estes Ave Unit 3
- 1535 W Estes Ave Unit 1
- 6809 N Lakewood Ave Unit 2N
- 1501 W Farwell Ave Unit 15011E
- 1501 W Farwell Ave Unit 15013W
- 1501 W Farwell Ave Unit 15012W
- 1501 W Farwell Ave Unit 15011W
- 1501 W Farwell Ave Unit 15012E
- 1501 W Farwell Ave Unit 2E
- 1501 W Farwell Ave Unit 1W
- 1501 W Farwell Ave Unit 2W
- 1501 W Farwell Ave Unit 3E
- 1501 W Farwell Ave Unit 1E
- 1444 W Farwell Ave
- 1442 W Farwell Ave
- 1500 W Farwell Ave
- 1440 W Farwell Ave
- 1440 W Farwell Ave Unit 2W
- 1440 W Farwell Ave Unit 2E
- 1440 W Farwell Ave Unit 3E
- 1440 W Farwell Ave Unit 1W
- 1440 W Farwell Ave Unit 3W
- 1440 W Farwell Ave Unit 1E