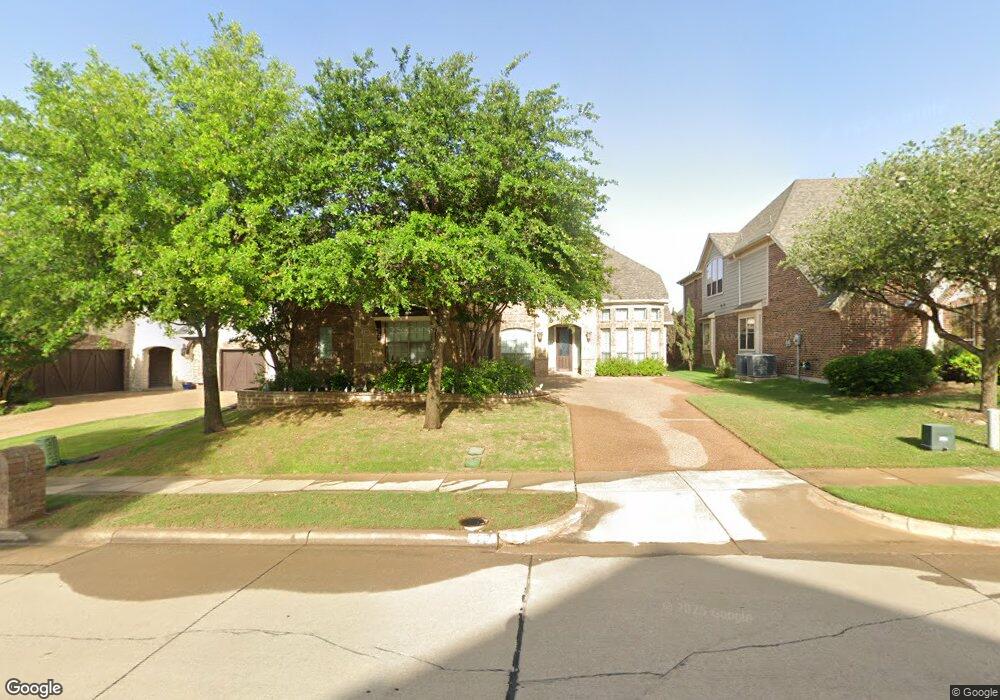
1501 Willingham Dr Allen, TX 75013
Twin Creeks NeighborhoodEstimated Value: $885,000 - $929,087
5
Beds
5
Baths
4,064
Sq Ft
$222/Sq Ft
Est. Value
About This Home
This home is located at 1501 Willingham Dr, Allen, TX 75013 and is currently estimated at $901,029, approximately $221 per square foot. 1501 Willingham Dr is a home located in Collin County with nearby schools including Kerr Elementary School, Ereckson Middle School, and Lowery Freshman Center.
Ownership History
Date
Name
Owned For
Owner Type
Purchase Details
Closed on
Jun 11, 2025
Sold by
Cragle Scott and Cragle Margo
Bought by
Cragle Family Trust and Cragle
Current Estimated Value
Purchase Details
Closed on
Mar 2, 2015
Sold by
Richard John Wesley and Banks Kamakki Janni Renee
Bought by
Cragle Scot and Cragle Margo
Home Financials for this Owner
Home Financials are based on the most recent Mortgage that was taken out on this home.
Original Mortgage
$360,000
Interest Rate
3.66%
Mortgage Type
New Conventional
Purchase Details
Closed on
Feb 28, 2011
Sold by
Grand Homes 2007 L P
Bought by
Richard John Wesley and Banks Kamakki Janni Renee
Home Financials for this Owner
Home Financials are based on the most recent Mortgage that was taken out on this home.
Original Mortgage
$419,246
Interest Rate
4.5%
Mortgage Type
New Conventional
Purchase Details
Closed on
Jul 12, 2010
Sold by
River Trail Estates Ltd
Bought by
Grand Homes 2007 Lp
Create a Home Valuation Report for This Property
The Home Valuation Report is an in-depth analysis detailing your home's value as well as a comparison with similar homes in the area
Home Values in the Area
Average Home Value in this Area
Purchase History
| Date | Buyer | Sale Price | Title Company |
|---|---|---|---|
| Cragle Family Trust | -- | None Listed On Document | |
| Cragle Scot | -- | None Available | |
| Richard John Wesley | -- | Ctic | |
| Grand Homes 2007 Lp | -- | Ct |
Source: Public Records
Mortgage History
| Date | Status | Borrower | Loan Amount |
|---|---|---|---|
| Previous Owner | Cragle Scot | $360,000 | |
| Previous Owner | Richard John Wesley | $419,246 |
Source: Public Records
Tax History Compared to Growth
Tax History
| Year | Tax Paid | Tax Assessment Tax Assessment Total Assessment is a certain percentage of the fair market value that is determined by local assessors to be the total taxable value of land and additions on the property. | Land | Improvement |
|---|---|---|---|---|
| 2025 | $11,214 | $787,741 | $190,000 | $658,376 |
| 2024 | $11,214 | $716,128 | $190,000 | $625,280 |
| 2023 | $11,214 | $651,025 | $160,000 | $651,804 |
| 2022 | $11,750 | $591,841 | $160,000 | $587,775 |
| 2021 | $11,439 | $538,037 | $125,000 | $413,037 |
| 2020 | $11,855 | $537,858 | $120,000 | $417,858 |
| 2019 | $12,122 | $524,747 | $120,000 | $404,747 |
| 2018 | $12,177 | $517,717 | $120,000 | $397,717 |
| 2017 | $11,653 | $495,430 | $110,000 | $385,430 |
| 2016 | $11,277 | $469,934 | $110,000 | $359,934 |
| 2015 | $10,241 | $449,336 | $110,000 | $339,336 |
Source: Public Records
Map
Nearby Homes
- 1516 Evanvale Dr
- 1632 Alamosa Dr
- 1526 Teresa Ann Ln
- 1711 Paytyn Dr
- 1550 Dulwich Dr
- 1548 Dulwich Dr
- 1554 Dulwich Dr
- 1560 Dulwich Dr
- 1558 Dulwich Dr
- 1562 Dulwich Dr
- 1566 Dulwich Dr
- 1568 Dulwich Dr
- 1552 Lake District Dr
- 1554 Lake District Dr
- 1558 Lake District Dr
- 1560 Lake District Dr
- 1566 Lake District Dr
- 1564 Lake District Dr
- Maverick Plan at The Avenue
- Appaloosa Plan at The Avenue
- 1497 Willingham Dr
- 1503 Willingham Dr
- 1500 Wesley Dr
- 1492 Wesley Dr
- 1505 Willingham Dr
- 1495 Willingham Dr
- 1502 Wesley Dr
- 1532 Riverdale Dr
- 1504 Wesley Dr
- 1507 Willingham Dr
- 1490 Wesley Dr
- 1493 Willingham Dr
- 1533 Evanvale Dr
- 1500 Willingham Dr
- 1530 Riverdale Dr
- 1506 Wesley Dr
- 1498 Willingham Dr
- 1509 Willingham Dr
- 1491 Willingham Dr
- 1488 Wesley Dr