
Landlord's Agent in 2025
Samir Sawhney
XCD Realty & Property Mgmt
(860) 559-0559
227 Total Sales

Estimated Value: $293,000 - $423,000
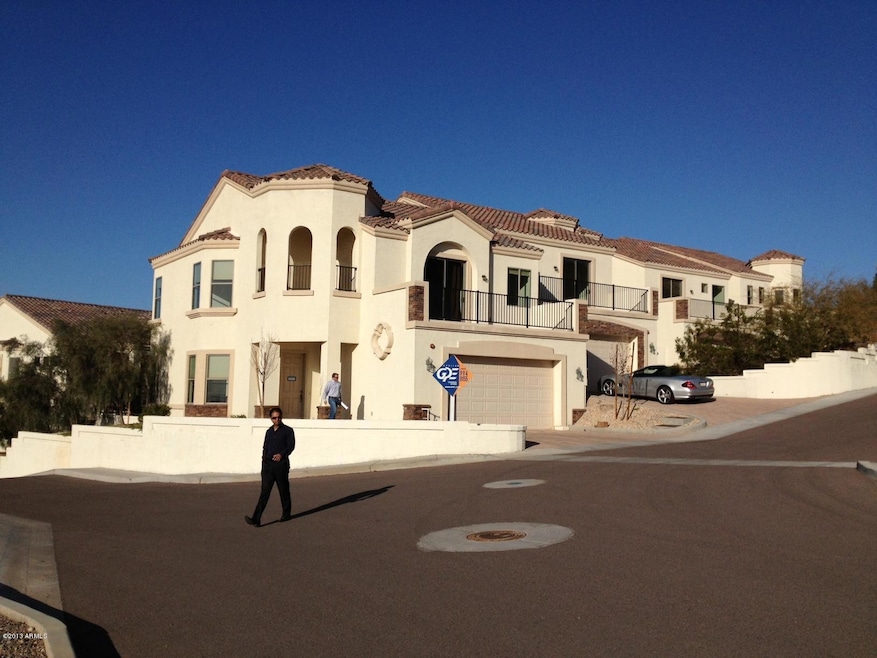
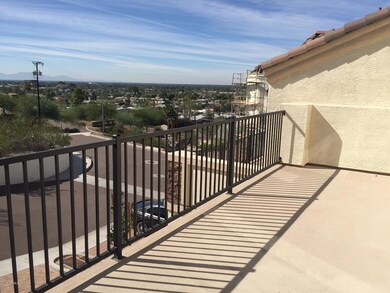
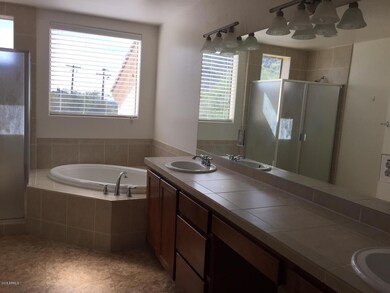
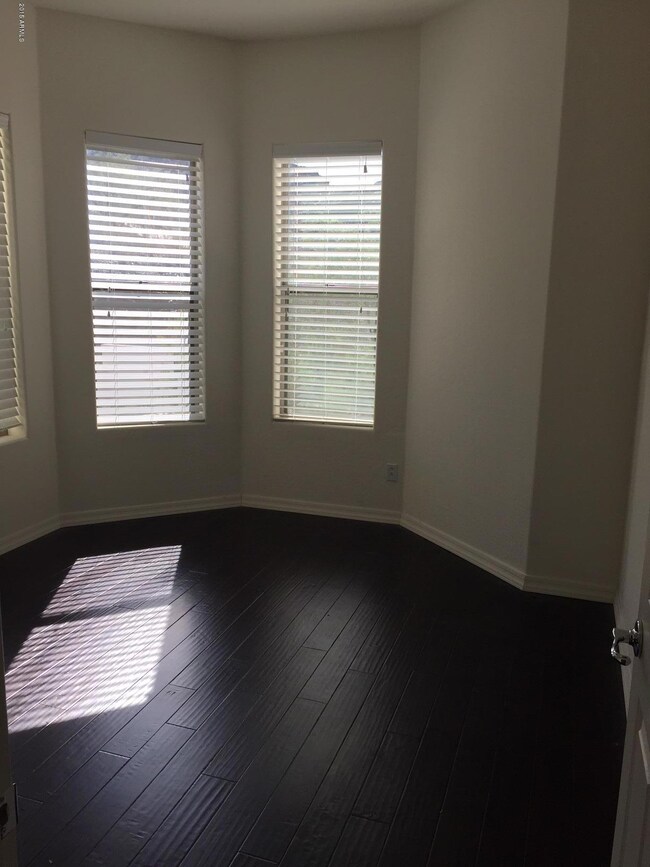
Hillside home with breathtaking views of the Phoenix skyline. 3 bedrooms plus a den with gleaming hardwood floors, stainless appliances, large walk-in closet, open kitchen with high ceilings. Secured community pool, balcony off master bedroom, jacuzzi en-suite and more.
Last Agent to Rent the Property
XCD Realty & Property Mgmt License #BR645393000 Listed on: 09/01/2025
| Date | Buyer | Sale Price | Title Company |
|---|---|---|---|
| Paramount Skyline Llc | $2,200,000 | Chicago Title Ins Co |
| Date | Status | Borrower | Loan Amount |
|---|---|---|---|
| Closed | Paramount Skyline Llc | $1,625,250 |
| Date | Event | Price | List to Sale | Price per Sq Ft |
|---|---|---|---|---|
| 11/21/2025 11/21/25 | Rented | $2,695 | 0.0% | -- |
| 10/23/2025 10/23/25 | Under Contract | -- | -- | -- |
| 09/01/2025 09/01/25 | For Rent | $2,695 | 0.0% | -- |
| 11/20/2022 11/20/22 | Rented | $2,695 | 0.0% | -- |
| 11/03/2022 11/03/22 | Under Contract | -- | -- | -- |
| 10/04/2022 10/04/22 | For Rent | $2,695 | +8.0% | -- |
| 10/08/2021 10/08/21 | Rented | $2,495 | 0.0% | -- |
| 10/04/2021 10/04/21 | Under Contract | -- | -- | -- |
| 09/25/2021 09/25/21 | For Rent | $2,495 | +25.1% | -- |
| 10/01/2020 10/01/20 | Rented | $1,995 | 0.0% | -- |
| 09/25/2020 09/25/20 | Under Contract | -- | -- | -- |
| 08/30/2020 08/30/20 | For Rent | $1,995 | 0.0% | -- |
| 08/12/2020 08/12/20 | Under Contract | -- | -- | -- |
| 08/03/2020 08/03/20 | For Rent | $1,995 | +14.0% | -- |
| 02/01/2018 02/01/18 | Rented | $1,750 | 0.0% | -- |
| 01/17/2018 01/17/18 | Under Contract | -- | -- | -- |
| 12/27/2017 12/27/17 | For Rent | $1,750 | +4.5% | -- |
| 11/01/2016 11/01/16 | Rented | $1,675 | 0.0% | -- |
| 10/20/2016 10/20/16 | Under Contract | -- | -- | -- |
| 10/11/2016 10/11/16 | For Rent | $1,675 | +3.1% | -- |
| 11/06/2015 11/06/15 | Rented | $1,625 | 0.0% | -- |
| 11/05/2015 11/05/15 | Under Contract | -- | -- | -- |
| 10/20/2015 10/20/15 | Price Changed | $1,625 | -1.5% | $1 / Sq Ft |
| 09/10/2015 09/10/15 | For Rent | $1,650 | +3.4% | -- |
| 09/22/2014 09/22/14 | Rented | $1,595 | 0.0% | -- |
| 09/09/2014 09/09/14 | Under Contract | -- | -- | -- |
| 09/02/2014 09/02/14 | For Rent | $1,595 | -- | -- |
| Year | Tax Paid | Tax Assessment Tax Assessment Total Assessment is a certain percentage of the fair market value that is determined by local assessors to be the total taxable value of land and additions on the property. | Land | Improvement |
|---|---|---|---|---|
| 2025 | $1,600 | $12,588 | -- | -- |
| 2024 | $1,512 | $11,989 | -- | -- |
| 2023 | $1,512 | $33,760 | $6,750 | $27,010 |
| 2022 | $1,462 | $22,590 | $4,510 | $18,080 |
| 2021 | $1,481 | $19,470 | $3,890 | $15,580 |
| 2020 | $1,444 | $22,890 | $4,570 | $18,320 |
| 2019 | $1,418 | $18,510 | $3,700 | $14,810 |
| 2018 | $1,381 | $19,270 | $3,850 | $15,420 |
| 2017 | $1,374 | $18,550 | $3,710 | $14,840 |
| 2016 | $1,349 | $21,880 | $4,370 | $17,510 |
| 2015 | $1,249 | $9,900 | $1,980 | $7,920 |
Landlord's Agent in 2025
Samir Sawhney
XCD Realty & Property Mgmt
(860) 559-0559
227 Total Sales
Tenant's Agent in 2025
Melissa Benavides
Valley King Properties, LLC
(253) 678-7364
A
Buyer's Agent in 2022
April Harriot-Peters
Real Broker
E
Buyer's Agent in 2021
Elizabeth Montoya
Valley King Properties, LLC
(602) 375-9959
B
Buyer's Agent in 2016
Barry Zweig
Realty One Group
(602) 989-4663
1 in this area
11 Total Sales
R
Buyer's Agent in 2015
Rosalba Hernandez-Garcia
HomeSmart
Source: Arizona Regional Multiple Listing Service (ARMLS)
MLS Number: 6913406
APN: 159-33-171
Disclaimer: Certain information contained herein is derived from information provided by parties other than Homes.com. All information provided is deemed reliable, but is not guaranteed to be accurate and should be independently verified.
![]() All information should be verified by the recipient and none is guaranteed as accurate by ARMLS
All information should be verified by the recipient and none is guaranteed as accurate by ARMLS
Listing Information presented by local MLS brokerage: Ten-X, local REALTOR®- Arlene Richardson - (888)-952-6393
Ask me questions while you tour the home.