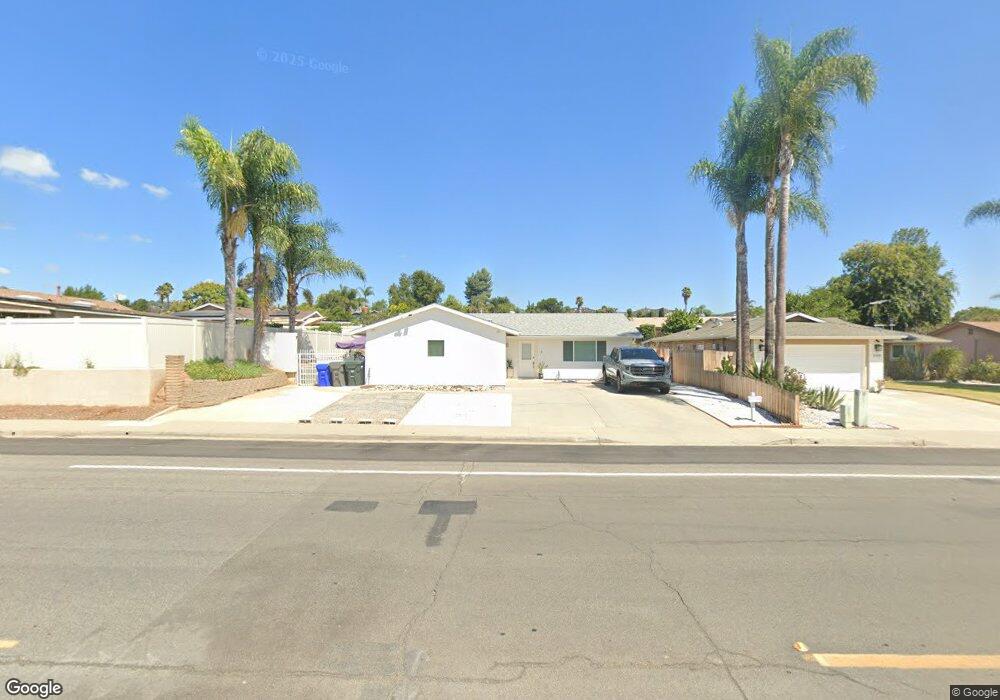
1502 Rock Springs Rd San Marcos, CA 92069
Estimated Value: $739,000 - $866,000
3
Beds
2
Baths
1,032
Sq Ft
$777/Sq Ft
Est. Value
About This Home
This home is located at 1502 Rock Springs Rd, San Marcos, CA 92069 and is currently estimated at $802,122, approximately $777 per square foot. 1502 Rock Springs Rd is a home located in San Diego County with nearby schools including Richland Elementary School, Woodland Park Middle School, and Mission Hills High School.
Ownership History
Date
Name
Owned For
Owner Type
Purchase Details
Closed on
May 21, 2010
Sold by
Cassis Cassie and Cassis Abraham
Bought by
Cassis Abraham George and Cassis Kenia Lizeth
Current Estimated Value
Purchase Details
Closed on
Jul 7, 2009
Sold by
Gmac Mortgage Llc
Bought by
Cassis Cassie and Cassis Abraham
Purchase Details
Closed on
Sep 11, 2008
Sold by
Carbajal Juan Gabriel and Carbajal Maria Elena
Bought by
Gmac Mortgage Llc
Purchase Details
Closed on
Oct 11, 2005
Sold by
Carbajal Miguel N and Carbajal Maria De Jesus
Bought by
Carbajal Juan Gabriel and Carbajal Maria Elena
Home Financials for this Owner
Home Financials are based on the most recent Mortgage that was taken out on this home.
Original Mortgage
$78,000
Interest Rate
5.9%
Mortgage Type
Unknown
Purchase Details
Closed on
Jul 21, 1989
Create a Home Valuation Report for This Property
The Home Valuation Report is an in-depth analysis detailing your home's value as well as a comparison with similar homes in the area
Home Values in the Area
Average Home Value in this Area
Purchase History
| Date | Buyer | Sale Price | Title Company |
|---|---|---|---|
| Cassis Abraham George | -- | Accommodation | |
| Cassis Cassie | $195,000 | First American Title Company | |
| Gmac Mortgage Llc | $243,000 | First American Title Ins Co | |
| Carbajal Juan Gabriel | $390,000 | Chicago Title Co | |
| -- | $135,000 | -- |
Source: Public Records
Mortgage History
| Date | Status | Borrower | Loan Amount |
|---|---|---|---|
| Previous Owner | Carbajal Juan Gabriel | $78,000 | |
| Previous Owner | Carbajal Juan Gabriel | $312,000 |
Source: Public Records
Tax History Compared to Growth
Tax History
| Year | Tax Paid | Tax Assessment Tax Assessment Total Assessment is a certain percentage of the fair market value that is determined by local assessors to be the total taxable value of land and additions on the property. | Land | Improvement |
|---|---|---|---|---|
| 2025 | $4,630 | $359,894 | $129,073 | $230,821 |
| 2024 | $4,630 | $352,839 | $126,543 | $226,296 |
| 2023 | $4,535 | $237,179 | $121,630 | $115,549 |
| 2022 | $3,321 | $237,179 | $121,630 | $115,549 |
| 2021 | $2,626 | $232,530 | $119,246 | $113,284 |
| 2020 | $2,602 | $230,147 | $118,024 | $112,123 |
| 2019 | $2,573 | $225,635 | $115,710 | $109,925 |
| 2018 | $2,491 | $221,212 | $113,442 | $107,770 |
| 2017 | $2,443 | $216,875 | $111,218 | $105,657 |
| 2016 | $2,405 | $212,624 | $109,038 | $103,586 |
| 2015 | $2,370 | $209,432 | $107,401 | $102,031 |
| 2014 | $2,317 | $205,331 | $105,298 | $100,033 |
Source: Public Records
Map
Nearby Homes
- 639 Butterwood Ave
- 1524 Brook Rd
- 1477 Glen Avon Dr
- 1609 Desert Glen
- 1796 Lindsley Park Dr
- 1708 Woodbridge Rd
- 0 Leaf Ln
- 1233 Titan Ct
- 1715 Las Palmas Ln
- 1708 Harold Rd
- 1401 W El Norte Pkwy Unit SPC 309
- 1401 W El Norte Pkwy Unit 145
- 1401 W El Norte Pkwy Unit SPC 25
- 1925 Rock Springs Rd Unit 1
- 1401 El Norte Pkwy Unit 34
- 1401 El Norte Pkwy Unit 60
- 1401 El Norte Pkwy Unit SPC 174
- 1401 El Norte Pkwy Unit 282
- 1401 El Norte Pkwy Unit SPC 326
- 1401 El Norte Pkwy Unit 145
- 1508 Rock Springs Rd
- 703 Butterfield Ln
- 711 Butterfield Ln
- 1511 Hilcorte Dr
- 1516 Rock Springs Rd
- 1503 Hilcorte Dr
- 719 Butterfield Ln
- 1528 Rock Springs Rd
- 1523 Hilcorte Dr
- 1503 Rock Springs Rd
- 1513 Rock Springs Rd
- 727 Butterfield Ln
- 1502 Hilcorte Dr
- 1501 Rock Springs Rd
- 1523 Rock Springs Rd
- 704 Butterfield Ln
- 1536 Rock Springs Rd
- 712 Butterfield Ln
- 1531 Hilcorte Dr
- 735 Butterfield Ln