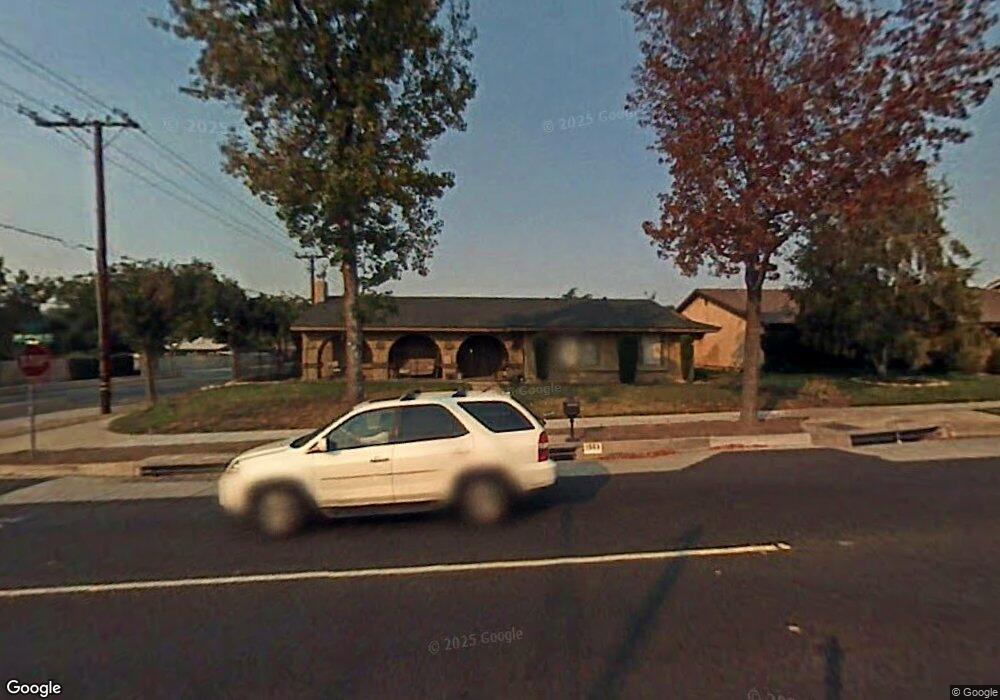
1503 N San Antonio Ave Upland, CA 91786
Estimated Value: $854,000 - $899,000
4
Beds
2
Baths
1,854
Sq Ft
$473/Sq Ft
Est. Value
About This Home
This home is located at 1503 N San Antonio Ave, Upland, CA 91786 and is currently estimated at $876,372, approximately $472 per square foot. 1503 N San Antonio Ave is a home located in San Bernardino County with nearby schools including Sycamore Elementary, Pioneer Junior High School, and Upland High School.
Ownership History
Date
Name
Owned For
Owner Type
Purchase Details
Closed on
Aug 24, 2005
Sold by
Haner Kurt
Bought by
Haner Kurt and Haner Lorrie
Current Estimated Value
Home Financials for this Owner
Home Financials are based on the most recent Mortgage that was taken out on this home.
Original Mortgage
$439,000
Outstanding Balance
$229,871
Interest Rate
5.61%
Mortgage Type
New Conventional
Estimated Equity
$646,501
Purchase Details
Closed on
Sep 23, 2004
Sold by
Haner Lorrie
Bought by
Haner Kurt and Haner Lorrie
Home Financials for this Owner
Home Financials are based on the most recent Mortgage that was taken out on this home.
Original Mortgage
$360,000
Interest Rate
8.94%
Mortgage Type
New Conventional
Purchase Details
Closed on
Nov 20, 1996
Sold by
Chen Ching Kuang and Chen Hui Fang
Bought by
Haner Kurt and Haner Lorrie
Home Financials for this Owner
Home Financials are based on the most recent Mortgage that was taken out on this home.
Original Mortgage
$109,900
Interest Rate
8.5%
Create a Home Valuation Report for This Property
The Home Valuation Report is an in-depth analysis detailing your home's value as well as a comparison with similar homes in the area
Home Values in the Area
Average Home Value in this Area
Purchase History
| Date | Buyer | Sale Price | Title Company |
|---|---|---|---|
| Haner Kurt | -- | Stewart Title Of Ca | |
| Haner Kurt | -- | Chicago Title Co | |
| Haner Lorrie | -- | Chicago Title Co | |
| Haner Kurt | $157,000 | Continental Lawyers Title Co |
Source: Public Records
Mortgage History
| Date | Status | Borrower | Loan Amount |
|---|---|---|---|
| Open | Haner Kurt | $439,000 | |
| Closed | Haner Lorrie | $360,000 | |
| Closed | Haner Kurt | $109,900 |
Source: Public Records
Tax History Compared to Growth
Tax History
| Year | Tax Paid | Tax Assessment Tax Assessment Total Assessment is a certain percentage of the fair market value that is determined by local assessors to be the total taxable value of land and additions on the property. | Land | Improvement |
|---|---|---|---|---|
| 2025 | $3,108 | $279,872 | $64,007 | $215,865 |
| 2024 | $3,108 | $274,384 | $62,752 | $211,632 |
| 2023 | $3,060 | $269,004 | $61,522 | $207,482 |
| 2022 | $2,994 | $263,730 | $60,316 | $203,414 |
| 2021 | $2,988 | $258,558 | $59,133 | $199,425 |
| 2020 | $2,907 | $255,907 | $58,527 | $197,380 |
| 2019 | $2,898 | $250,889 | $57,379 | $193,510 |
| 2018 | $2,829 | $245,970 | $56,254 | $189,716 |
| 2017 | $2,748 | $241,147 | $55,151 | $185,996 |
| 2016 | $2,557 | $236,419 | $54,070 | $182,349 |
| 2015 | $2,499 | $232,868 | $53,258 | $179,610 |
| 2014 | $2,435 | $228,307 | $52,215 | $176,092 |
Source: Public Records
Map
Nearby Homes
- 1427 N San Antonio Ave
- 1018 W 15th St
- 1623 N Vallejo Way
- 1547 Shamrock Ave
- 388 Harford Place
- 882 W 17th St
- 1629 N Palm Ave
- 1469 N Erin Ave
- 1099 Sullivan St
- 1604 N Laurel Ave
- 1613 Erin Ave
- 939 W Pine St Unit 44
- 880 W Pine St
- 1669 Erin Ave
- 1404 N Euclid Ave
- 1754 N Tulare Way
- 1146 Oneil St
- 1193 W 13th St
- 1788 N Coolcrest Ave
- 1346 N Euclid Ave
- 1509 N San Antonio Ave
- 1497 N San Antonio Ave
- 1502 N Albright Ave
- 1515 N San Antonio Ave
- 1510 N Albright Ave
- 1496 N Albright Ave
- 1514 N Albright Ave
- 1491 N San Antonio Ave
- 1521 N San Antonio Ave
- 1498 N San Antonio Ave
- 1490 N Albright Ave
- 1522 N Albright Ave
- 1483 N San Antonio Ave
- 1490 N San Antonio Ave
- 1527 N San Antonio Ave
- 1503 N Albright Ave
- 1482 N Albright Ave
- 1511 N Albright Ave
- 1528 N Albright Ave
- 1497 N Albright Ave