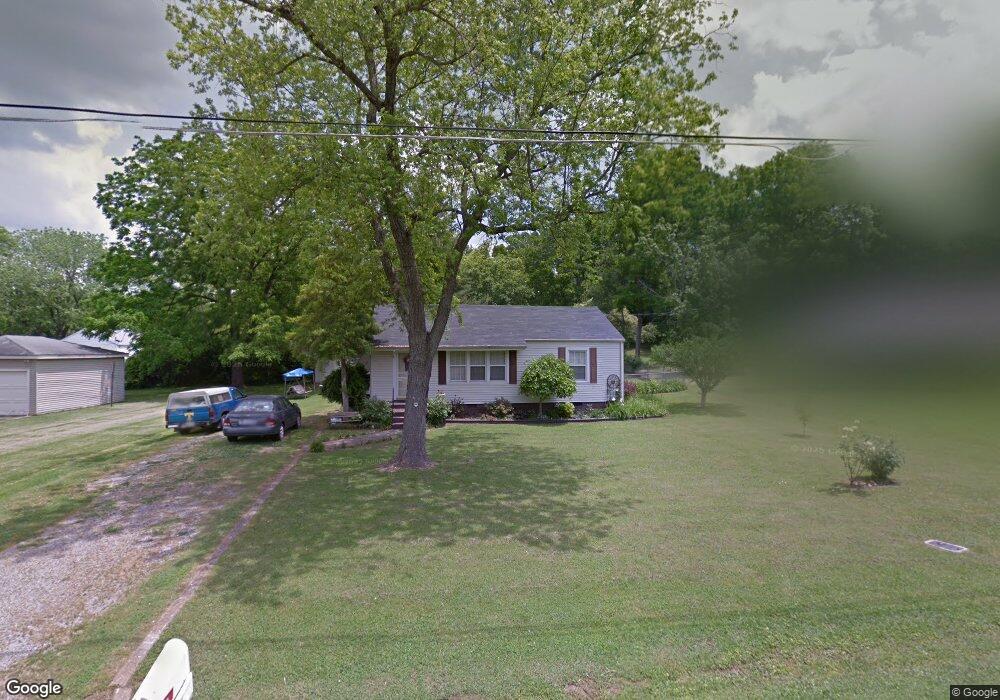
1503 Parker Ave Shelbyville, TN 37160
Estimated Value: $139,259 - $235,000
--
Bed
1
Bath
912
Sq Ft
$190/Sq Ft
Est. Value
About This Home
This home is located at 1503 Parker Ave, Shelbyville, TN 37160 and is currently estimated at $173,565, approximately $190 per square foot. 1503 Parker Ave is a home located in Bedford County with nearby schools including South Side Elementary School, Harris Middle School, and Christian Chapel Academy.
Ownership History
Date
Name
Owned For
Owner Type
Purchase Details
Closed on
Apr 16, 2021
Sold by
Arney James L and Estate Of Vicky Carder Arney
Bought by
Arney James L
Current Estimated Value
Purchase Details
Closed on
Feb 4, 2013
Sold by
Dunn John
Bought by
Carder Vicky W
Purchase Details
Closed on
May 25, 2010
Sold by
Thomas Ashley M
Bought by
Carder Vicky W
Home Financials for this Owner
Home Financials are based on the most recent Mortgage that was taken out on this home.
Original Mortgage
$63,000
Interest Rate
5%
Purchase Details
Closed on
Jun 19, 2002
Sold by
Dunn John and Dunn Kim
Bought by
Thomas Ashley M
Home Financials for this Owner
Home Financials are based on the most recent Mortgage that was taken out on this home.
Original Mortgage
$66,326
Interest Rate
6.86%
Purchase Details
Closed on
Apr 14, 2000
Sold by
Barkley Barry G
Bought by
Dunn John and Dunn Kim
Purchase Details
Closed on
Jul 11, 1978
Bought by
Redd James F and Redd Patricia T
Create a Home Valuation Report for This Property
The Home Valuation Report is an in-depth analysis detailing your home's value as well as a comparison with similar homes in the area
Home Values in the Area
Average Home Value in this Area
Purchase History
| Date | Buyer | Sale Price | Title Company |
|---|---|---|---|
| Arney James L | -- | None Available | |
| Carder Vicky W | -- | -- | |
| Carder Vicky W | $63,000 | -- | |
| Thomas Ashley M | $65,000 | -- | |
| Dunn John | $30,500 | -- | |
| Redd James F | -- | -- |
Source: Public Records
Mortgage History
| Date | Status | Borrower | Loan Amount |
|---|---|---|---|
| Previous Owner | Redd James F | $63,000 | |
| Previous Owner | Redd James F | $66,326 |
Source: Public Records
Tax History Compared to Growth
Tax History
| Year | Tax Paid | Tax Assessment Tax Assessment Total Assessment is a certain percentage of the fair market value that is determined by local assessors to be the total taxable value of land and additions on the property. | Land | Improvement |
|---|---|---|---|---|
| 2025 | -- | $22,050 | $0 | $0 |
| 2024 | -- | $22,050 | $5,625 | $16,425 |
| 2023 | $326 | $22,050 | $5,625 | $16,425 |
| 2022 | $864 | $22,050 | $5,625 | $16,425 |
| 2021 | $784 | $22,050 | $5,625 | $16,425 |
| 2020 | $681 | $22,050 | $5,625 | $16,425 |
| 2019 | $681 | $15,375 | $2,500 | $12,875 |
| 2018 | $666 | $15,375 | $2,500 | $12,875 |
| 2017 | $666 | $15,375 | $2,500 | $12,875 |
| 2016 | $660 | $15,375 | $2,500 | $12,875 |
| 2015 | $660 | $15,375 | $2,500 | $12,875 |
| 2014 | $582 | $14,841 | $0 | $0 |
Source: Public Records
Map
Nearby Homes
- 1511 Parker Ave
- 1505 Parker Ave
- 300 Lafayette St
- 1502 Phillips Dr
- 304 Lafayette St
- 1504 Parker Ave
- 0 Crest Dr
- 204 Lafayette St
- 1508 Parker Ave
- 300 Crest Dr
- 1 Parker St
- 1510 Parker Ave
- 400 Lafayette St
- 303 Lafayette St
- 301 Lafayette St
- 1512 Parker Ave
- 305 Lafayette St
- 207 Lafayette St
- 1 Parker Ave
- 1503 Wilson St