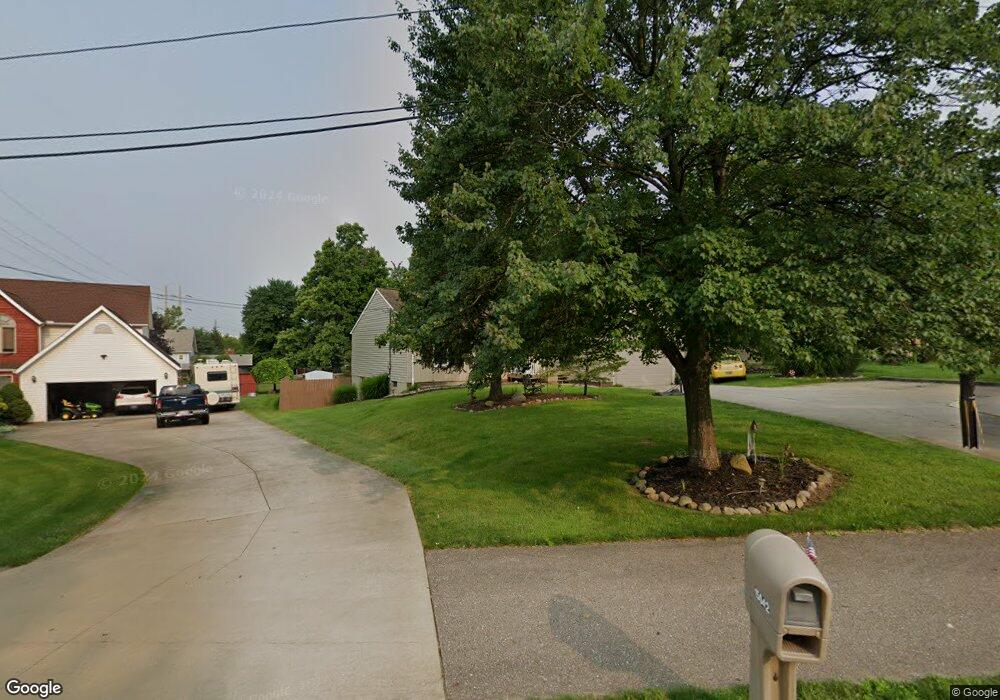
15030 Bennett Rd North Royalton, OH 44133
Estimated Value: $298,435 - $332,000
3
Beds
2
Baths
1,368
Sq Ft
$229/Sq Ft
Est. Value
About This Home
This home is located at 15030 Bennett Rd, North Royalton, OH 44133 and is currently estimated at $312,609, approximately $228 per square foot. 15030 Bennett Rd is a home located in Cuyahoga County with nearby schools including North Royalton Middle School, North Royalton High School, and Saint Albert the Great Roman Catholic School.
Ownership History
Date
Name
Owned For
Owner Type
Purchase Details
Closed on
Jun 9, 2005
Sold by
Reece Deborah A
Bought by
Deka Dale M and Deka Lisa M
Current Estimated Value
Home Financials for this Owner
Home Financials are based on the most recent Mortgage that was taken out on this home.
Original Mortgage
$140,400
Outstanding Balance
$74,004
Interest Rate
5.91%
Mortgage Type
Fannie Mae Freddie Mac
Estimated Equity
$238,605
Purchase Details
Closed on
Dec 1, 2000
Sold by
Reece Robert F and Reece Deborah A
Bought by
Reece Deborah
Purchase Details
Closed on
Mar 21, 1991
Sold by
Reece Robert F
Bought by
Reece Deborah A
Purchase Details
Closed on
Feb 27, 1990
Sold by
Borkey Michael Kdba
Bought by
Reece Robert F
Purchase Details
Closed on
Jan 1, 1989
Bought by
Bennett Const Co
Create a Home Valuation Report for This Property
The Home Valuation Report is an in-depth analysis detailing your home's value as well as a comparison with similar homes in the area
Home Values in the Area
Average Home Value in this Area
Purchase History
| Date | Buyer | Sale Price | Title Company |
|---|---|---|---|
| Deka Dale M | $175,500 | Landamerica | |
| Reece Deborah | -- | -- | |
| Reece Deborah A | -- | -- | |
| Reece Robert F | $82,900 | -- | |
| Borkey Michael Kdba | $14,400 | -- | |
| Bennett Const Co | -- | -- |
Source: Public Records
Mortgage History
| Date | Status | Borrower | Loan Amount |
|---|---|---|---|
| Open | Deka Dale M | $140,400 |
Source: Public Records
Tax History Compared to Growth
Tax History
| Year | Tax Paid | Tax Assessment Tax Assessment Total Assessment is a certain percentage of the fair market value that is determined by local assessors to be the total taxable value of land and additions on the property. | Land | Improvement |
|---|---|---|---|---|
| 2024 | $5,715 | $98,385 | $6,300 | $92,085 |
| 2023 | $4,323 | $68,260 | $13,900 | $54,360 |
| 2022 | $4,294 | $68,250 | $13,895 | $54,355 |
| 2021 | $4,339 | $68,250 | $13,900 | $54,360 |
| 2020 | $3,935 | $58,840 | $11,970 | $46,870 |
| 2019 | $3,820 | $168,100 | $34,200 | $133,900 |
| 2018 | $4,112 | $58,840 | $11,970 | $46,870 |
| 2017 | $4,934 | $52,220 | $11,970 | $40,250 |
| 2016 | $3,983 | $52,220 | $11,970 | $40,250 |
| 2015 | $3,388 | $52,220 | $11,970 | $40,250 |
| 2014 | $3,388 | $52,220 | $11,970 | $40,250 |
Source: Public Records
Map
Nearby Homes
- 7400 Akins Rd
- 8381 N Akins Rd Unit H7
- 13831 Woodcroft Trace
- 9447 Lindberg Dr
- S/L Margaret Dr
- 12906 Cartwright Pkwy
- 13000 Cartwright Pkwy
- 7554 Margaret Dr
- 7595 Margaret Dr
- 7545 Margaret Dr
- 7585 Margaret Dr
- 7575 Margaret Dr
- 7535 Margaret Dr
- 7555 Margaret Dr
- 7600 Margaret Dr
- 7564 Margaret Dr
- 7574 Margaret Dr
- 12701 Gordon St
- 16577 State Rd
- 5299 Whistler Ct
- 15020 Bennett Rd
- 15042 Bennett Rd
- 0 Akins Rd
- 8164 N Akins Rd
- 8164 N Akins Rd
- 14990 Bennett Rd
- 15049 Bennett Rd
- 7831 Akins Rd
- 15005 Bennett Rd
- 14786 Bennett Rd
- 7660 Akins Rd
- 8180 N Akins Rd
- 7679 Akins Rd
- 7679 Akins Rd
- 14961 Bennett Rd
- 14774 Bennett Rd
- 14921 Bennett Rd
- 8188 N Akins Rd
- 7667 Akins Rd
- 7550 Akins Rd