Estimated Value: $372,151 - $412,000
4
Beds
3
Baths
2,210
Sq Ft
$178/Sq Ft
Est. Value
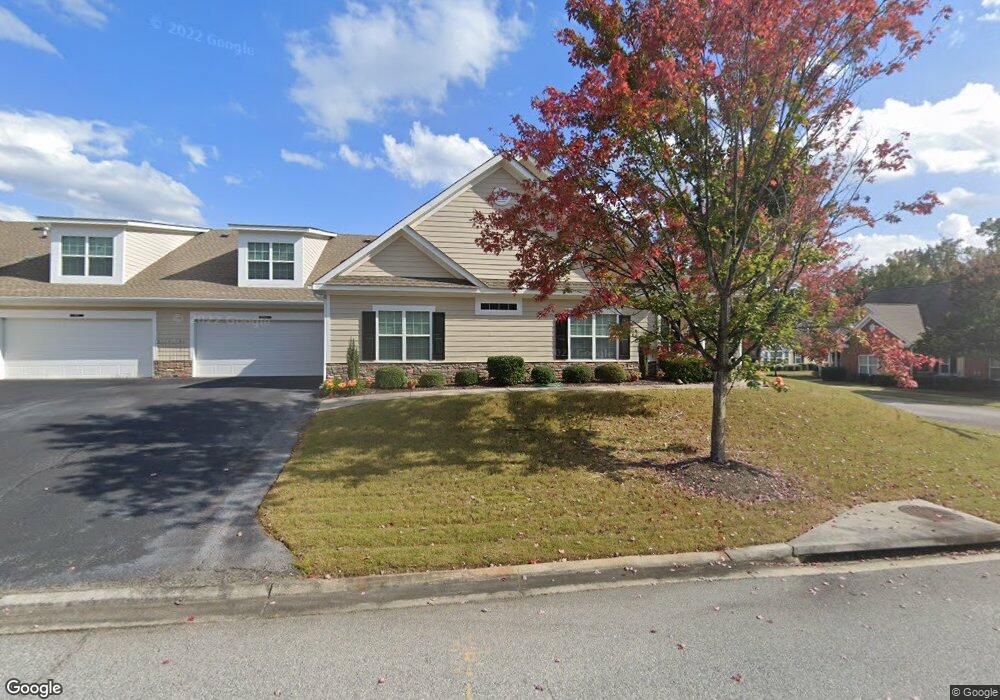
About This Home
This home is located at 1504 Amberley Dr, Evans, GA 30809 and is currently estimated at $393,038, approximately $177 per square foot. 1504 Amberley Dr is a home located in Columbia County with nearby schools including Greenbrier Elementary School, Greenbrier Middle School, and Greenbrier High School.
Ownership History
Date
Name
Owned For
Owner Type
Purchase Details
Closed on
Oct 26, 2022
Sold by
Hyatt Victor L
Bought by
Hyatt Victor L and Hyatt Starr N
Current Estimated Value
Purchase Details
Closed on
Mar 15, 2022
Sold by
Weiksner John M
Bought by
Hyatt Victor L and Hyatt Starr N
Purchase Details
Closed on
Mar 20, 2019
Sold by
Weiksner John Michael
Bought by
Weiksner John Michael and Weiksner Susan W
Purchase Details
Closed on
Jun 17, 2014
Sold by
Weiksner Shirley Garner
Bought by
Weiksner John Michael and Hummel Mary Lynn
Purchase Details
Closed on
Feb 28, 2006
Sold by
Ivey Residential Llc
Bought by
Weiksner Charles F
Create a Home Valuation Report for This Property
The Home Valuation Report is an in-depth analysis detailing your home's value as well as a comparison with similar homes in the area
Home Values in the Area
Average Home Value in this Area
Purchase History
We collect this data history from publicly available records. To have your information removed, we recommend requesting removal directly through your county’s website.
| Date | Buyer | Sale Price | Title Company |
|---|---|---|---|
| Hyatt Victor L | -- | -- | |
| Hyatt Victor L | $325,000 | -- | |
| Weiksner John Michael | $110,000 | -- | |
| Weiksner John Michael | -- | -- | |
| Weiksner Charles F | $232,000 | -- |
Source: Public Records
Tax History
| Year | Tax Paid | Tax Assessment Tax Assessment Total Assessment is a certain percentage of the fair market value that is determined by local assessors to be the total taxable value of land and additions on the property. | Land | Improvement |
|---|---|---|---|---|
| 2025 | $1,180 | $149,166 | $30,304 | $118,862 |
| 2024 | $1,168 | $142,573 | $28,004 | $114,569 |
| 2023 | $1,168 | $130,000 | $26,680 | $103,320 |
| 2022 | $3,139 | $118,552 | $23,204 | $95,348 |
| 2021 | $3,048 | $109,980 | $21,204 | $88,776 |
| 2020 | $2,854 | $100,696 | $19,404 | $81,292 |
| 2019 | $2,736 | $96,446 | $19,004 | $77,442 |
| 2018 | $2,692 | $94,558 | $19,404 | $75,154 |
| 2017 | $2,578 | $90,135 | $18,404 | $71,731 |
| 2016 | $2,382 | $86,198 | $18,580 | $67,618 |
| 2015 | $2,369 | $85,547 | $18,580 | $66,967 |
| 2014 | $2,342 | $83,499 | $16,380 | $67,119 |
Source: Public Records
Map
Nearby Homes
- 1502 Amberley Dr
- 2303 Amberley Pass
- 929 Mitchell Ln
- 968 Mitchell Ln
- 314 Burnhill Ave
- 1005 Mitchell Ln
- 1006 Mitchell Ln
- 7519 Lucas Ave
- 919 Pennington Way
- 506 Windermere St
- 998 Napiers Post Dr
- 4081 Dewaal St
- 338 Buxton Ln
- 4076 Dewaal St
- 979 Windmill Ln
- 810 Glencoe Way
- 965 Napiers Post Dr
- 971 Windmill Ln
- 967 Windmill Ln
- 845 Glencoe Way
- 1603 Amberley Dr
- 1601 Amberley Dr
- 1604 Amberley Dr
- 1803 Amberley Dr Unit 1800
- 1803 Amberley Dr
- 1602 Amberley Dr
- 1801 Amberley Dr Unit 1800
- 1801 Amberley Dr
- 1403 Amberley Dr
- 1503 Amberley Dr
- 2001 Amberley Dr
- 1404 Amberley Dr
- 1501 Amberley Dr
- 1804 Amberley Dr Unit 1800
- 1804 Amberley Dr
- 1802 Amberley Dr
- 1802 Amberley Dr Unit 1800
- 1401 Amberley Dr
- 2003 Amberley Dr Unit 2000
- 2003 Amberley Dr
Your Personal Tour Guide
Ask me questions while you tour the home.