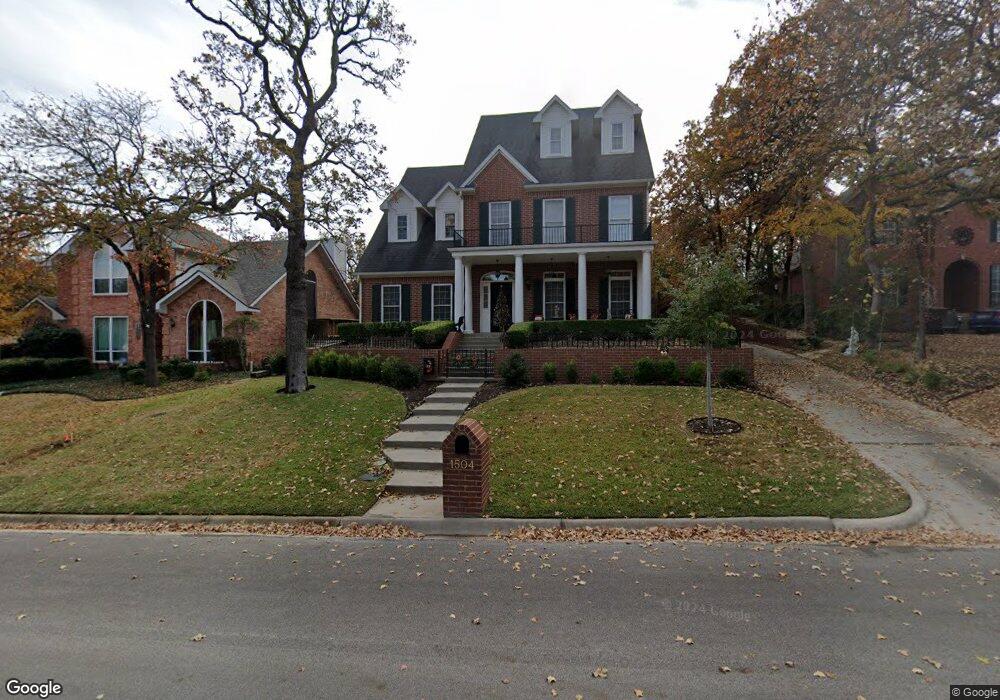
1504 Gatewood Dr Denton, TX 76205
South Denton NeighborhoodEstimated Value: $502,767 - $539,000
4
Beds
3
Baths
2,461
Sq Ft
$213/Sq Ft
Est. Value
About This Home
This home is located at 1504 Gatewood Dr, Denton, TX 76205 and is currently estimated at $523,442, approximately $212 per square foot. 1504 Gatewood Dr is a home located in Denton County with nearby schools including Houston Elementary School, McMath Middle School, and Denton High School.
Ownership History
Date
Name
Owned For
Owner Type
Purchase Details
Closed on
Jun 16, 2000
Sold by
Lowrie Virgil A
Bought by
Foster Phillip R and Foster Lorena M
Current Estimated Value
Home Financials for this Owner
Home Financials are based on the most recent Mortgage that was taken out on this home.
Original Mortgage
$30,375
Interest Rate
7.84%
Mortgage Type
Purchase Money Mortgage
Purchase Details
Closed on
Nov 20, 1995
Sold by
Paschal Samuel D and Paschal Maria
Bought by
Lowrie Virgil A
Home Financials for this Owner
Home Financials are based on the most recent Mortgage that was taken out on this home.
Original Mortgage
$23,500
Interest Rate
7.48%
Mortgage Type
Seller Take Back
Purchase Details
Closed on
Nov 7, 1994
Sold by
Mvrm Denton Joint Venture
Bought by
Paschal Samuel D and Paschal Maria
Create a Home Valuation Report for This Property
The Home Valuation Report is an in-depth analysis detailing your home's value as well as a comparison with similar homes in the area
Home Values in the Area
Average Home Value in this Area
Purchase History
| Date | Buyer | Sale Price | Title Company |
|---|---|---|---|
| Foster Phillip R | -- | First American Title Co | |
| Foster Phillip R | -- | First American Title Co | |
| Lowrie Virgil A | -- | -- | |
| Lowrie Virgil A | -- | -- | |
| Paschal Samuel D | -- | -- | |
| Paschal Samuel D | -- | -- |
Source: Public Records
Mortgage History
| Date | Status | Borrower | Loan Amount |
|---|---|---|---|
| Previous Owner | Foster Phillip R | $30,375 | |
| Previous Owner | Lowrie Virgil A | $23,500 |
Source: Public Records
Tax History Compared to Growth
Tax History
| Year | Tax Paid | Tax Assessment Tax Assessment Total Assessment is a certain percentage of the fair market value that is determined by local assessors to be the total taxable value of land and additions on the property. | Land | Improvement |
|---|---|---|---|---|
| 2025 | $3,613 | $547,769 | $85,000 | $471,941 |
| 2024 | $9,612 | $497,972 | $0 | $0 |
| 2023 | $3,620 | $452,702 | $85,000 | $435,543 |
| 2022 | $8,736 | $411,547 | $75,000 | $375,612 |
| 2021 | $8,317 | $374,134 | $50,000 | $324,134 |
| 2020 | $7,860 | $343,876 | $48,645 | $295,231 |
| 2019 | $8,211 | $344,119 | $48,645 | $295,474 |
| 2018 | $7,853 | $325,073 | $48,645 | $278,292 |
| 2017 | $7,305 | $295,521 | $48,645 | $250,548 |
| 2016 | $5,704 | $268,655 | $48,645 | $220,490 |
| 2015 | $5,756 | $244,232 | $48,645 | $195,587 |
| 2014 | $5,756 | $240,685 | $48,645 | $192,040 |
| 2013 | -- | $235,058 | $48,645 | $186,413 |
Source: Public Records
Map
Nearby Homes
- 916 Smokerise Cir
- 720 Smokerise Cir
- 2253 Hollyhill Ln
- 1012 Indian Ridge Dr
- 2272 Hollyhill Ln
- 1108 Ellison Park Cir
- 2009 Lake Fork Ct
- 924 Ridgecrest Cir
- 2000 Lamprey Cir
- 2544 Natchez Trace
- 1000 Lynhurst Ln
- 2312 Caddo Cir
- 2209 Loon Lake Rd
- 2218 Southridge Dr
- 2501 Great Bear Ln
- 829 Skylark Dr
- 824 Sandpiper Dr
- 2226 Savannah Trail
- 816 Chapel Dr
- 821 Sandpiper Dr
- 1508 Gatewood Dr
- 1500 Gatewood Dr
- 1512 Gatewood Dr
- 1416 Gatewood Dr
- 1405 Hunters Ridge Cir
- 1409 Hunters Ridge Cir
- 1509 Gatewood Dr
- 1501 Gatewood Dr
- 1412 Gatewood Dr
- 1516 Gatewood Dr
- 1401 Hunters Ridge Cir
- 708 Lafayette Dr
- 1413 Gatewood Dr
- 1408 Gatewood Dr
- 1504 Lynhurst Ln
- 1500 Lynhurst Ln
- 1409 Gatewood Dr
- 1508 Lynhurst Ln
- 1417 Hunters Ridge Cir
- 1500 Hunters Ridge Cir