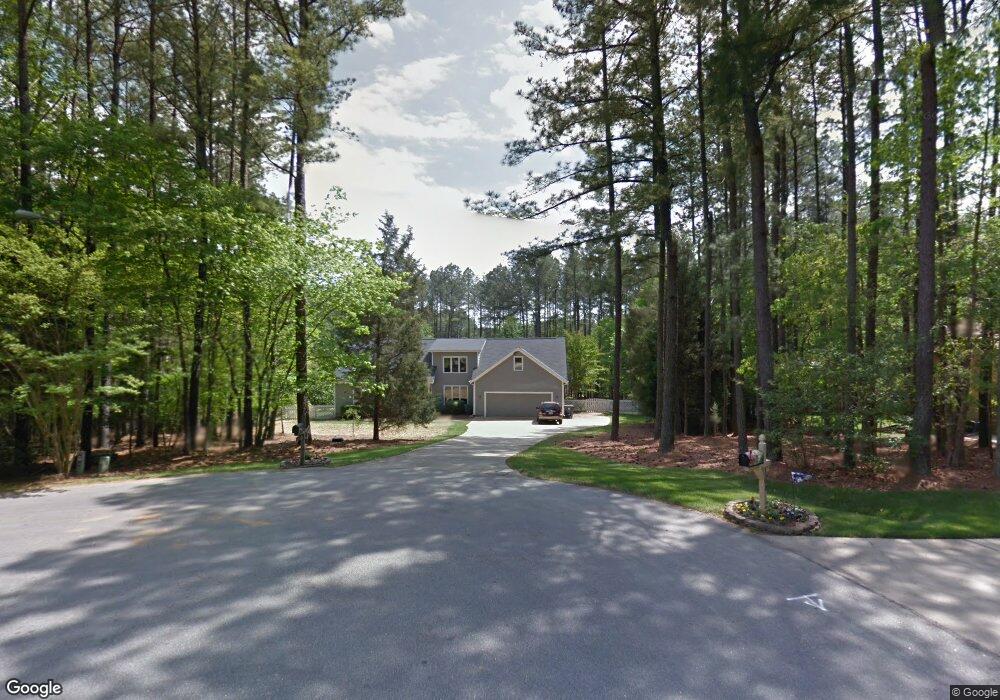
1504 Hempbridge Dr Raleigh, NC 27614
Falls Lake NeighborhoodEstimated Value: $804,779 - $828,000
4
Beds
3
Baths
2,916
Sq Ft
$280/Sq Ft
Est. Value
About This Home
This home is located at 1504 Hempbridge Dr, Raleigh, NC 27614 and is currently estimated at $817,445, approximately $280 per square foot. 1504 Hempbridge Dr is a home located in Wake County with nearby schools including Brassfield Elementary School, West Millbrook Middle School, and Millbrook High School.
Ownership History
Date
Name
Owned For
Owner Type
Purchase Details
Closed on
Mar 5, 2012
Sold by
Dellisanti Vincent
Bought by
Gingue Pierre E
Current Estimated Value
Home Financials for this Owner
Home Financials are based on the most recent Mortgage that was taken out on this home.
Original Mortgage
$280,000
Outstanding Balance
$193,529
Interest Rate
4%
Mortgage Type
New Conventional
Estimated Equity
$623,916
Purchase Details
Closed on
Jun 15, 2009
Sold by
Hinkle John E and Hinkle Shelley L
Bought by
Dellisanti Vincent
Home Financials for this Owner
Home Financials are based on the most recent Mortgage that was taken out on this home.
Original Mortgage
$36,100
Interest Rate
4.77%
Mortgage Type
Credit Line Revolving
Purchase Details
Closed on
Mar 25, 2002
Sold by
Lang David T and Lang Jean L
Bought by
Hinkle John E
Home Financials for this Owner
Home Financials are based on the most recent Mortgage that was taken out on this home.
Original Mortgage
$257,500
Interest Rate
5.75%
Create a Home Valuation Report for This Property
The Home Valuation Report is an in-depth analysis detailing your home's value as well as a comparison with similar homes in the area
Home Values in the Area
Average Home Value in this Area
Purchase History
| Date | Buyer | Sale Price | Title Company |
|---|---|---|---|
| Gingue Pierre E | $350,000 | None Available | |
| Dellisanti Vincent | $365,000 | None Available | |
| Hinkle John E | $325,000 | -- |
Source: Public Records
Mortgage History
| Date | Status | Borrower | Loan Amount |
|---|---|---|---|
| Open | Gingue Pierre E | $280,000 | |
| Previous Owner | Dellisanti Vincent | $36,100 | |
| Previous Owner | Hinkle John E | $257,500 | |
| Closed | Hinkle John E | $35,000 |
Source: Public Records
Tax History Compared to Growth
Tax History
| Year | Tax Paid | Tax Assessment Tax Assessment Total Assessment is a certain percentage of the fair market value that is determined by local assessors to be the total taxable value of land and additions on the property. | Land | Improvement |
|---|---|---|---|---|
| 2025 | $4,791 | $745,953 | $240,000 | $505,953 |
| 2024 | $4,652 | $745,953 | $240,000 | $505,953 |
| 2023 | $3,626 | $462,520 | $100,000 | $362,520 |
| 2022 | $3,360 | $462,520 | $100,000 | $362,520 |
| 2021 | $3,270 | $462,520 | $100,000 | $362,520 |
| 2020 | $3,216 | $462,520 | $100,000 | $362,520 |
| 2019 | $3,184 | $387,422 | $150,000 | $237,422 |
| 2018 | $2,927 | $387,422 | $150,000 | $237,422 |
| 2017 | $2,775 | $387,422 | $150,000 | $237,422 |
| 2016 | $2,718 | $387,422 | $150,000 | $237,422 |
| 2015 | $2,864 | $409,467 | $154,000 | $255,467 |
| 2014 | $2,714 | $409,467 | $154,000 | $255,467 |
Source: Public Records
Map
Nearby Homes
- 1209 Ravens Point Cir
- 5420 Deer Forest Trail
- 1508 Acres Way
- 12301 Hardee Rd
- 6729 Greywalls Ln
- 1421 Alpine Creek Dr
- 11100 Honeycutt Rd
- 9925 Koupela Dr
- 904 Stonecutter Ct
- 308 Swans Mill Crossing
- 900 Stonecutter Ct
- 12712 Lindley Dr
- 600 Brittany Bay E
- 10708 Trappers Creek Dr
- 4708 Wynneford Way
- 10721 Marabou Ct
- 10912 Cahill Rd
- 12812 Lindley Dr
- 6820 Brixley Cir
- 917 Welland Ct
- 1500 Hempbridge Dr
- 1508 Hempbridge Dr
- 1501 Midhurst Ct
- 1501 Hempbridge Dr
- 1505 Hempbridge Dr
- 1509 Hempbridge Dr
- 1505 Midhurst Ct
- 1500 Midhurst Ct
- 1516 Sharnbrook Ct
- 1509 Midhurst Ct
- 1601 Morning Mountain Rd
- 1508 Sharnbrook Ct
- 1504 Midhurst Ct
- 1504 Sharnbrook Ct
- 1201 Ravens Point Cir
- 1608 Sharnbrook Ct
- 1612 Sharnbrook Ct
- 1508 Midhurst Ct
- 1620 Sharnbrook Ct
- 1205 Ravens Point Cir