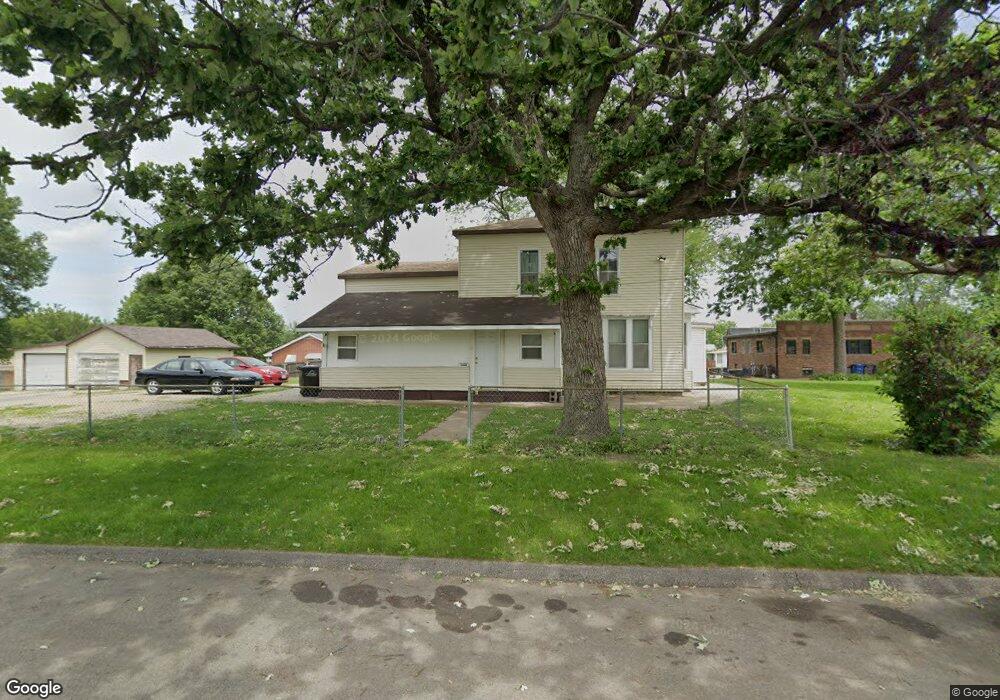
1504 Hull Ave Des Moines, IA 50316
Highland Park NeighborhoodEstimated Value: $175,248 - $222,000
4
Beds
3
Baths
1,978
Sq Ft
$100/Sq Ft
Est. Value
About This Home
This home is located at 1504 Hull Ave, Des Moines, IA 50316 and is currently estimated at $198,624, approximately $100 per square foot. 1504 Hull Ave is a home located in Polk County with nearby schools including Cattell Elementary School, Goodrell Middle School, and North High School.
Ownership History
Date
Name
Owned For
Owner Type
Purchase Details
Closed on
Aug 30, 2024
Sold by
Draper Hannah S
Bought by
Draper David L and Draper Daniel R
Current Estimated Value
Purchase Details
Closed on
Jan 28, 2019
Sold by
Alexander Mellissa A
Bought by
Draper David L and Draper Daniel R
Purchase Details
Closed on
Feb 23, 2017
Sold by
Draper Steve D and Draper Laurie L
Bought by
Draper David L and Draper Daniel R
Purchase Details
Closed on
Jun 15, 2015
Sold by
Grand View University
Bought by
Draper Steven
Purchase Details
Closed on
Jun 30, 2006
Sold by
Grand View College
Bought by
Draper Steven
Home Financials for this Owner
Home Financials are based on the most recent Mortgage that was taken out on this home.
Original Mortgage
$50,274
Interest Rate
6.68%
Mortgage Type
Seller Take Back
Purchase Details
Closed on
Aug 18, 2004
Sold by
Grandanette Joseph L
Bought by
Grand View College
Create a Home Valuation Report for This Property
The Home Valuation Report is an in-depth analysis detailing your home's value as well as a comparison with similar homes in the area
Home Values in the Area
Average Home Value in this Area
Purchase History
| Date | Buyer | Sale Price | Title Company |
|---|---|---|---|
| Draper David L | -- | None Listed On Document | |
| Draper David L | -- | None Available | |
| Draper David L | -- | None Available | |
| Draper Steven | $80,000 | Attorney | |
| Draper Steven | $80,000 | Itc | |
| Grand View College | $112,000 | -- |
Source: Public Records
Mortgage History
| Date | Status | Borrower | Loan Amount |
|---|---|---|---|
| Previous Owner | Draper Steven | $50,274 |
Source: Public Records
Tax History Compared to Growth
Tax History
| Year | Tax Paid | Tax Assessment Tax Assessment Total Assessment is a certain percentage of the fair market value that is determined by local assessors to be the total taxable value of land and additions on the property. | Land | Improvement |
|---|---|---|---|---|
| 2024 | $3,470 | $176,400 | $36,100 | $140,300 |
| 2023 | $3,308 | $176,400 | $36,100 | $140,300 |
| 2022 | $3,284 | $140,400 | $30,200 | $110,200 |
| 2021 | $3,040 | $140,400 | $30,200 | $110,200 |
| 2020 | $3,158 | $121,800 | $26,400 | $95,400 |
| 2019 | $3,080 | $121,800 | $26,400 | $95,400 |
| 2018 | $3,048 | $114,600 | $24,600 | $90,000 |
| 2017 | $2,816 | $114,600 | $24,600 | $90,000 |
| 2016 | $2,744 | $104,100 | $22,300 | $81,800 |
| 2015 | $2,744 | $104,100 | $22,300 | $81,800 |
| 2014 | $2,798 | $105,300 | $22,300 | $83,000 |
Source: Public Records
Map
Nearby Homes
- 1422 Hull Ave
- 1424 Richmond Ave
- 1428 E Tiffin Ave
- 1520 E Tiffin Ave
- 2706 E 16th St
- 1432 Royer St
- 1332 E Sheridan Ave
- 2517 Sampson St
- 1424 Milton Ave
- 2529 Glenbrook Dr
- 1109 E Sheridan Ave
- 903 Morton Ave
- 816 Boyd St
- 1514 Guthrie Ave
- 2336 E 13th St
- 3007 E 8th St
- 3215 E 8th St
- 3315 E 8th St
- 1617 Guthrie Ave
- 3623 Wright St
- 1505 Richmond Ave
- 1444 Hull Ave
- 3012 E 15th St
- 1445 Richmond Ave
- 1511 Richmond Ave
- 1510 Hull Ave
- 1311 Hull Ave
- 1441 Richmond Ave
- 1440 Hull Ave
- 1437 Richmond Ave
- 1504 Richmond Ave
- 1436 Hull Ave
- 1517 Richmond Ave
- 1520 Hull Ave
- 1508 Richmond Ave
- 1433 Richmond Ave
- 1434 Hull Ave
- 1444 Richmond Ave
- 1521 Richmond Ave
- 1516 Richmond Ave