
Seller's Agent in 2016
Sue Hedlund
RE/MAX Suburban
(630) 710-7374
3 in this area
48 Total Sales
Estimated Value: $396,000 - $485,000
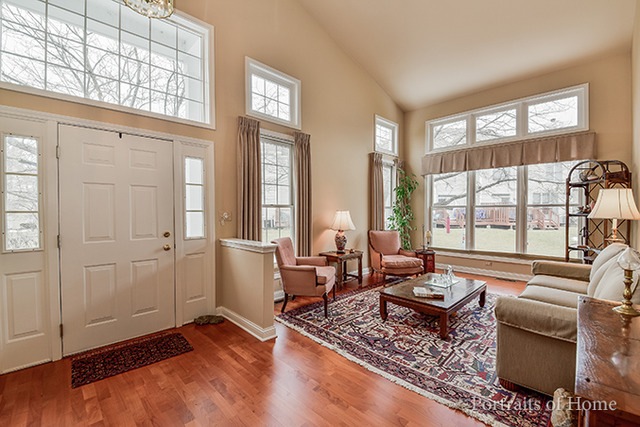
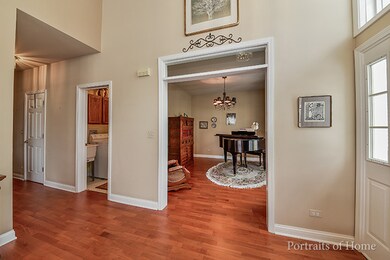
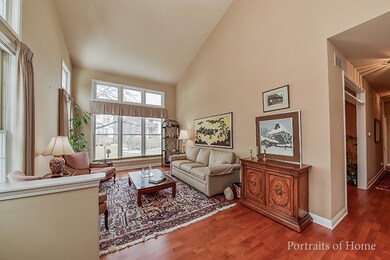
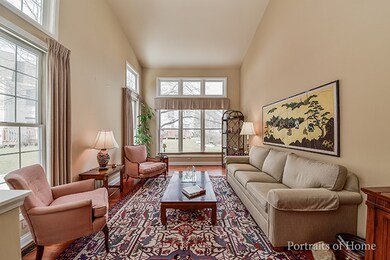
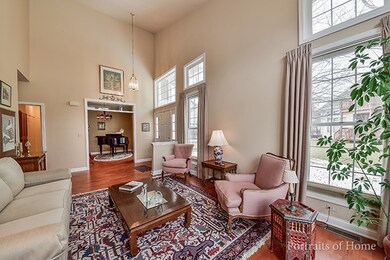
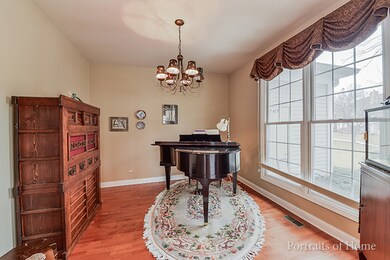
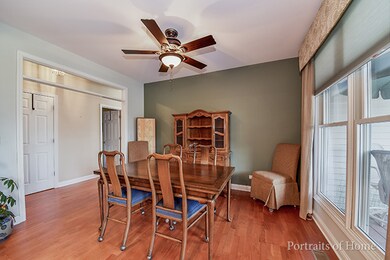
Highly desirable Ranch Unit, all first floor, no steps! Located at the end of a quiet cul-de-sac w pretty views, close to shopping, pace bus pickup, Riverwalk, downtown and hospital, parks and ponds, ideal location! Totally redesigned newer kitchen, removed wall and opened the kitchen to the dining room and doubled the amount of cabinets and counter space, gorgeous chocolate glazed maple cabinets, granite counters, center island with breakfast bar, stone subway backspash, cherry floors in kitchen, dining room, living room and den! Sunny bright end unit w vaulted ceilings, transom windows, awesome views, peaceful and serene, tucked away at the end of a quite cul-de-sac. Master bedroom has walk in closet and double door closet and private bath, in addition to large guest bath and guest bedroom. There is a full unfinished basement w high ceilings and roughed in plumbing, great for storage but also could be easily finished at a later date.
Last Agent to Sell the Property
RE/MAX Suburban License #475090623 Listed on: 03/05/2016
| Date | Buyer | Sale Price | Title Company |
|---|---|---|---|
| Chen Gang | $280,000 | Citywide Title Corporation | |
| Sanders Nizza Sunny | $260,000 | Attorney | |
| Davis Mary H | -- | None Available | |
| Davis Mary H | $322,000 | None Available | |
| Holley William G | $166,000 | -- |
| Date | Status | Borrower | Loan Amount |
|---|---|---|---|
| Previous Owner | Chen Gang | $210,000 | |
| Previous Owner | Sanders Nizza Sunny | $242,910 | |
| Previous Owner | Holley William G | $80,000 |
| Date | Event | Price | List to Sale | Price per Sq Ft |
|---|---|---|---|---|
| 06/17/2016 06/17/16 | Sold | $260,000 | -3.7% | $161 / Sq Ft |
| 05/13/2016 05/13/16 | Pending | -- | -- | -- |
| 05/06/2016 05/06/16 | Price Changed | $269,900 | -1.9% | $167 / Sq Ft |
| 04/12/2016 04/12/16 | Price Changed | $275,000 | -3.5% | $170 / Sq Ft |
| 03/22/2016 03/22/16 | For Sale | $285,000 | 0.0% | $176 / Sq Ft |
| 03/16/2016 03/16/16 | Pending | -- | -- | -- |
| 03/05/2016 03/05/16 | For Sale | $285,000 | -- | $176 / Sq Ft |
| Year | Tax Paid | Tax Assessment Tax Assessment Total Assessment is a certain percentage of the fair market value that is determined by local assessors to be the total taxable value of land and additions on the property. | Land | Improvement |
|---|---|---|---|---|
| 2024 | $6,405 | $120,549 | $26,713 | $93,836 |
| 2023 | $6,109 | $110,020 | $24,380 | $85,640 |
| 2022 | $5,761 | $100,010 | $22,160 | $77,850 |
| 2021 | $5,532 | $96,230 | $21,320 | $74,910 |
| 2020 | $6,118 | $94,500 | $20,940 | $73,560 |
| 2019 | $5,951 | $90,410 | $20,030 | $70,380 |
| 2018 | $6,024 | $91,490 | $20,270 | $71,220 |
| 2017 | $5,511 | $88,410 | $19,590 | $68,820 |
| 2016 | $5,023 | $85,210 | $18,880 | $66,330 |
| 2015 | $4,991 | $80,240 | $17,780 | $62,460 |
| 2014 | $4,939 | $77,350 | $17,140 | $60,210 |
| 2013 | $4,865 | $77,530 | $17,180 | $60,350 |
Seller's Agent in 2016
Sue Hedlund
RE/MAX Suburban
(630) 710-7374
3 in this area
48 Total Sales
Buyer's Agent in 2016
Brian Evans
Option Premier LLC
(630) 544-0072
39 Total Sales
Source: Midwest Real Estate Data (MRED)
MLS Number: MRD09157206
APN: 08-29-312-058
Disclaimer: Certain information contained herein is derived from information provided by parties other than Homes.com. All information provided is deemed reliable, but is not guaranteed to be accurate and should be independently verified.
![]() Based on information submitted to the MLS GRID. All data is obtained from various sources and may not have been verified by broker or MLS GRID. Supplied Open House Information is subject to change without notice. All information should be independently reviewed and verified for accuracy. Properties may or may not be listed by the office/agent presenting the information. Some IDX listings have been excluded from this website.
Based on information submitted to the MLS GRID. All data is obtained from various sources and may not have been verified by broker or MLS GRID. Supplied Open House Information is subject to change without notice. All information should be independently reviewed and verified for accuracy. Properties may or may not be listed by the office/agent presenting the information. Some IDX listings have been excluded from this website.
The Digital Millennium Copyright Act of 1998, 17 U.S.C. § 512 (the “DMCA”) provides recourse for copyright owners who believe that material appearing on the Internet infringes their rights under U.S. copyright law. If you believe in good faith that any content or material made available in connection with our website or services infringes your copyright, you (or your agent) may send us a notice requesting that the content or material be removed, or access to it blocked.
Notices must be sent in writing by email to DMCAnotice@MLSGrid.com.
The DMCA requires that your notice of alleged copyright infringement include the following information:
(1) description of the copyrighted work that is the subject of claimed infringement;
(2) description of the alleged infringing content and information sufficient to permit us to locate the content;
(3) contact information for you, including your address, telephone number and email address;
(4) a statement by you that you have a good faith belief that the content in the manner complained of is not authorized by the copyright owner, or its agent, or by the operation of any law;
(5) a statement by you, signed under penalty of perjury, that the information in the notification is accurate and that you have the authority to enforce the copyrights that are claimed to be infringed; and
(6) a physical or electronic signature of the copyright owner or a person authorized to act on the copyright owner’s behalf. Failure to include all of the above information may result in the delay of the processing of your complaint.