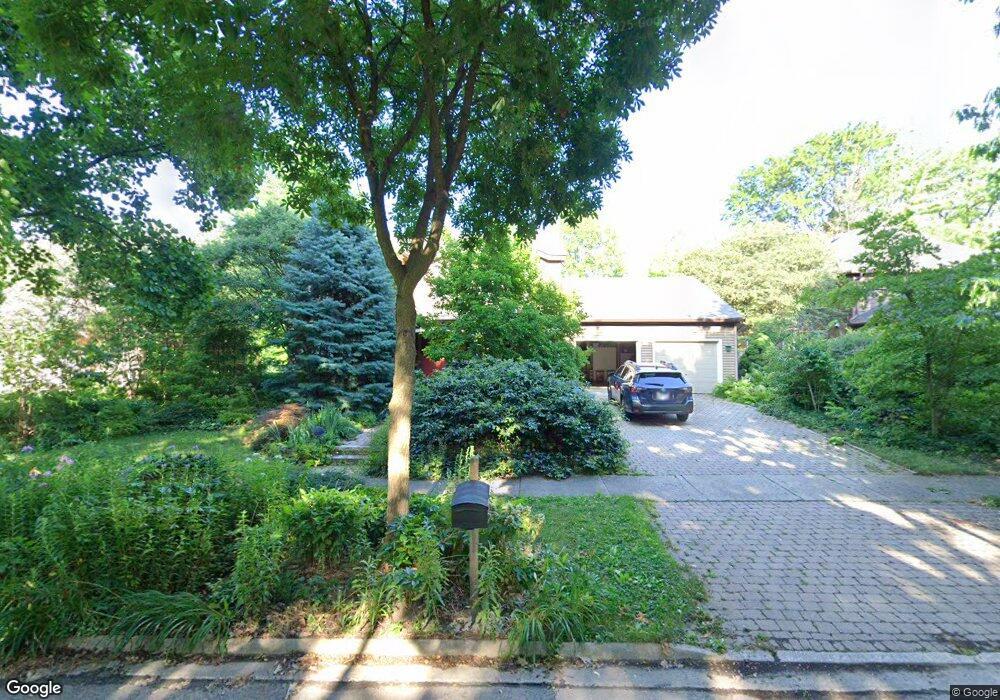
1504 Maple Knoll Ct Naperville, IL 60563
Indian Hill NeighborhoodEstimated Value: $449,000 - $778,000
Studio
1
Bath
2,872
Sq Ft
$210/Sq Ft
Est. Value
About This Home
This home is located at 1504 Maple Knoll Ct, Naperville, IL 60563 and is currently estimated at $602,191, approximately $209 per square foot. 1504 Maple Knoll Ct is a home located in DuPage County with nearby schools including Beebe Elementary School, Jefferson Jr High School, and Naperville North High School.
Ownership History
Date
Name
Owned For
Owner Type
Purchase Details
Closed on
Jun 11, 2025
Sold by
Jacqueline Vernot Living Trust and Vernot Jacqueline A
Bought by
Callahan Family Trust and Callahan
Current Estimated Value
Home Financials for this Owner
Home Financials are based on the most recent Mortgage that was taken out on this home.
Original Mortgage
$418,000
Interest Rate
4.77%
Mortgage Type
Seller Take Back
Purchase Details
Closed on
Jul 29, 2020
Sold by
Vernot Jacqueline
Bought by
Vernot Jacqueline and Jacqueline Vernot Living Trust
Purchase Details
Closed on
Nov 29, 2000
Sold by
Frank Paul Development Corp
Bought by
Kotz Raymond P and Vernot Jacqueline A
Home Financials for this Owner
Home Financials are based on the most recent Mortgage that was taken out on this home.
Original Mortgage
$336,000
Interest Rate
7.7%
Purchase Details
Closed on
Sep 14, 2000
Sold by
Abdul Malek Adel B
Bought by
Frank Paul Development Corp
Home Financials for this Owner
Home Financials are based on the most recent Mortgage that was taken out on this home.
Original Mortgage
$500,000
Interest Rate
10%
Create a Home Valuation Report for This Property
The Home Valuation Report is an in-depth analysis detailing your home's value as well as a comparison with similar homes in the area
Home Values in the Area
Average Home Value in this Area
Purchase History
| Date | Buyer | Sale Price | Title Company |
|---|---|---|---|
| Callahan Family Trust | $440,000 | Proper Title | |
| Vernot Jacqueline | -- | Attorney | |
| Kotz Raymond P | $420,000 | Prairie Title | |
| Frank Paul Development Corp | $300,000 | First American Title Ins |
Source: Public Records
Mortgage History
| Date | Status | Borrower | Loan Amount |
|---|---|---|---|
| Previous Owner | Callahan Family Trust | $418,000 | |
| Previous Owner | Kotz Raymond P | $336,000 | |
| Previous Owner | Frank Paul Development Corp | $500,000 |
Source: Public Records
Tax History
| Year | Tax Paid | Tax Assessment Tax Assessment Total Assessment is a certain percentage of the fair market value that is determined by local assessors to be the total taxable value of land and additions on the property. | Land | Improvement |
|---|---|---|---|---|
| 2024 | -- | $192,328 | $68,613 | $123,715 |
| 2023 | $10,366 | $175,530 | $62,620 | $112,910 |
| 2022 | $10,198 | $168,580 | $60,140 | $108,440 |
| 2021 | $9,815 | $162,210 | $57,870 | $104,340 |
| 2020 | $9,600 | $159,290 | $56,830 | $102,460 |
| 2019 | $9,307 | $152,400 | $54,370 | $98,030 |
| 2018 | $9,310 | $152,400 | $54,370 | $98,030 |
| 2017 | $9,112 | $147,260 | $52,540 | $94,720 |
| 2016 | $8,919 | $141,940 | $50,640 | $91,300 |
| 2015 | $8,843 | $133,670 | $47,690 | $85,980 |
| 2014 | $8,657 | $127,300 | $47,690 | $79,610 |
| 2013 | $8,527 | $127,600 | $47,800 | $79,800 |
Source: Public Records
Map
Nearby Homes
- 1557 Chickasaw Dr
- 1221 N Loomis St
- 26W250 Case St
- 1229 Suffolk St
- 5S365 Vest Ave
- 541 Braemar Ave
- 930 N Loomis St
- 1437 N Charles Ave
- 1310 Eagle St
- 1314 N Eagle St
- 27W141 48th St
- 837 N Loomis St
- 1112 Iroquois Ave Unit 12
- 825 Biltmore Ct
- 719 N Brainard St
- 717 N Brainard St
- 715 N Brainard St
- 818 Fairwinds Ct
- 905 N Webster St
- 1104 N Mill St Unit 205
- 1508 Maple Knoll Ct
- 511 E Bauer Rd
- 514 Pawnee Ln
- 1512 Maple Knoll Ct
- 515 E Bauer Rd
- 1501 Maple Knoll Ct
- 1505 Maple Knoll Ct
- 1509 Maple Knoll Ct
- 518 Pawnee Ln
- 519 E Bauer Rd
- 1515 Maple Knoll Ct
- 508 E Bauer Rd
- 1516 Maple Knoll Ct
- 504 E Bauer Rd
- 512 E Bauer Rd
- 411 E Bauer Rd
- 1520 Maple Knoll Ct
- 1517 Maple Knoll Ct
- 1517 Maple Knoll Ct
- 516 E Bauer Rd
Your Personal Tour Guide
Ask me questions while you tour the home.