Estimated Value: $439,000 - $483,000
3
Beds
2
Baths
1,800
Sq Ft
$253/Sq Ft
Est. Value
About This Home
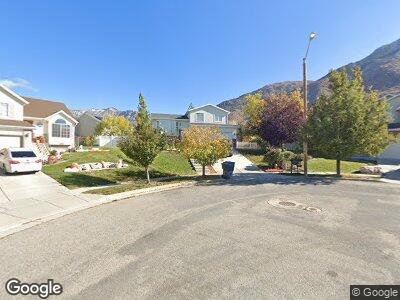
This home is located at 1504 N Fowler Ave, Ogden, UT 84404 and is currently estimated at $455,991, approximately $253 per square foot. 1504 N Fowler Ave is a home located in Weber County with nearby schools including Lincoln School, Highland Junior High School, and Ben Lomond High School.
Ownership History
Date
Name
Owned For
Owner Type
Purchase Details
Closed on
Aug 24, 2001
Sold by
Justin Higley Construction Inc and Higley Justin Mark
Bought by
Merrill David C
Current Estimated Value
Home Financials for this Owner
Home Financials are based on the most recent Mortgage that was taken out on this home.
Original Mortgage
$133,898
Interest Rate
7.21%
Purchase Details
Closed on
Feb 20, 2001
Sold by
Silver Creek Development Lc
Bought by
Justin Higley Construction Inc
Home Financials for this Owner
Home Financials are based on the most recent Mortgage that was taken out on this home.
Original Mortgage
$107,100
Interest Rate
6.89%
Create a Home Valuation Report for This Property
The Home Valuation Report is an in-depth analysis detailing your home's value as well as a comparison with similar homes in the area
Home Values in the Area
Average Home Value in this Area
Purchase History
| Date | Buyer | Sale Price | Title Company |
|---|---|---|---|
| Merrill David C | -- | -- | |
| Justin Higley Construction Inc | -- | First American Title |
Source: Public Records
Mortgage History
| Date | Status | Borrower | Loan Amount |
|---|---|---|---|
| Open | Merrill David C | $175,864 | |
| Closed | Merrill David C | $175,538 | |
| Closed | Merrill David C | $175,790 | |
| Closed | Merrill David C | $180,107 | |
| Closed | Merrill David C | $178,876 | |
| Closed | Merrill David C | $177,625 | |
| Closed | Merrill David C | $153,000 | |
| Closed | Merrill David C | $22,200 | |
| Closed | Merrill David C | $133,898 | |
| Previous Owner | Justin Higley Construction Inc | $107,100 |
Source: Public Records
Tax History Compared to Growth
Tax History
| Year | Tax Paid | Tax Assessment Tax Assessment Total Assessment is a certain percentage of the fair market value that is determined by local assessors to be the total taxable value of land and additions on the property. | Land | Improvement |
|---|---|---|---|---|
| 2024 | $2,849 | $224,949 | $78,713 | $146,236 |
| 2023 | $2,928 | $232,650 | $75,779 | $156,871 |
| 2022 | $3,121 | $248,601 | $56,381 | $192,220 |
| 2021 | $2,361 | $312,000 | $77,256 | $234,744 |
| 2020 | $2,237 | $273,000 | $60,953 | $212,047 |
| 2019 | $2,129 | $244,000 | $49,121 | $194,879 |
| 2018 | $1,933 | $220,000 | $45,225 | $174,775 |
| 2017 | $1,881 | $200,000 | $45,225 | $154,775 |
| 2016 | $1,918 | $110,211 | $22,278 | $87,933 |
| 2015 | $1,652 | $92,620 | $22,278 | $70,342 |
| 2014 | $1,683 | $92,620 | $21,394 | $71,226 |
Source: Public Records
Map
Nearby Homes
- 1504 N Fowler Ave
- 948 E 1500 N
- 948 E 1500 N
- 1492 N Fowler Ave
- 827 E 1525 N
- 819 E 1525 N Unit 30
- 819 E 1525 N
- 873 E 1510 N
- 942 E 1500 N
- 1484 N Fowler Ave
- 813 E 1525 N Unit 29
- 1522 N 825 E Unit 32
- 1483 N Lewis Peak Dr
- 940 E 1500 N
- 879 E 1510 N Unit 55
- 1491 N Fowler Ave
- 807 E 1525 N
- 1478 N Fowler Ave
- 1479 N Lewis Peak Dr
- 972 E Cold Water Way