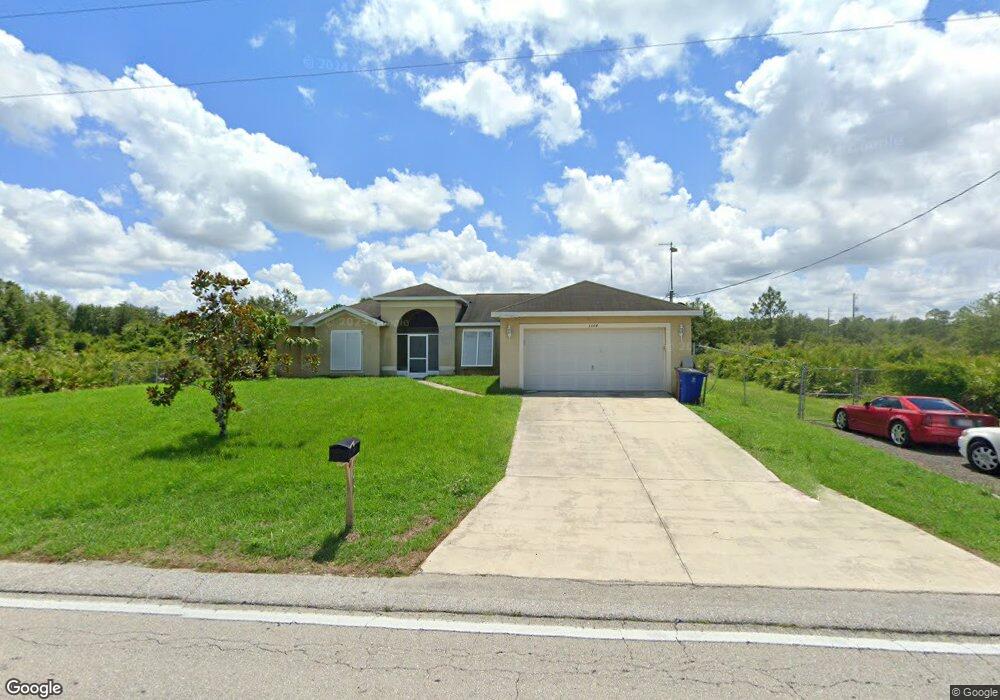
1504 Richmond Ave N Unit 11 Lehigh Acres, FL 33972
Joel NeighborhoodEstimated Value: $301,516 - $379,000
4
Beds
2
Baths
1,668
Sq Ft
$200/Sq Ft
Est. Value
About This Home
This home is located at 1504 Richmond Ave N Unit 11, Lehigh Acres, FL 33972 and is currently estimated at $334,129, approximately $200 per square foot. 1504 Richmond Ave N Unit 11 is a home located in Lee County with nearby schools including Lehigh Elementary School, The Alva School, and Gateway Elementary School.
Ownership History
Date
Name
Owned For
Owner Type
Purchase Details
Closed on
Oct 24, 2013
Sold by
Thibeault Kenneth and Thibeault Elaine
Bought by
Thibeault Wayne
Current Estimated Value
Purchase Details
Closed on
May 14, 2009
Sold by
Ctx Mortgage Company Llc
Bought by
Thibeault Kenneth and Thibeault Elaine
Purchase Details
Closed on
Dec 30, 2008
Sold by
Graham Teri and Graham Teri S
Bought by
Ctx Mortgage Company Llc
Purchase Details
Closed on
Feb 17, 2006
Sold by
Zielonka Mariusz
Bought by
Graham Teri
Home Financials for this Owner
Home Financials are based on the most recent Mortgage that was taken out on this home.
Original Mortgage
$347,456
Interest Rate
6.05%
Mortgage Type
Construction
Purchase Details
Closed on
Apr 23, 2004
Sold by
Girwarr Baldeo Oudit and Girwarr Nayheedath
Bought by
Zielonka Mariusz
Create a Home Valuation Report for This Property
The Home Valuation Report is an in-depth analysis detailing your home's value as well as a comparison with similar homes in the area
Home Values in the Area
Average Home Value in this Area
Purchase History
| Date | Buyer | Sale Price | Title Company |
|---|---|---|---|
| Thibeault Wayne | -- | Attorney | |
| Thibeault Kenneth | $68,500 | Metropolitan Title & Guarant | |
| Ctx Mortgage Company Llc | -- | None Available | |
| Graham Teri | $85,000 | Dba Commerce Title Company | |
| Zielonka Mariusz | $7,000 | -- |
Source: Public Records
Mortgage History
| Date | Status | Borrower | Loan Amount |
|---|---|---|---|
| Previous Owner | Graham Teri | $347,456 |
Source: Public Records
Tax History Compared to Growth
Tax History
| Year | Tax Paid | Tax Assessment Tax Assessment Total Assessment is a certain percentage of the fair market value that is determined by local assessors to be the total taxable value of land and additions on the property. | Land | Improvement |
|---|---|---|---|---|
| 2025 | $413 | $119,758 | -- | -- |
| 2024 | $380 | $116,383 | -- | -- |
| 2023 | $380 | $0 | $0 | $0 |
| 2022 | $364 | $104,469 | $0 | $0 |
| 2021 | $311 | $174,821 | $6,500 | $168,321 |
| 2020 | $304 | $96,799 | $0 | $0 |
| 2019 | $292 | $94,623 | $0 | $0 |
| 2018 | $619 | $92,859 | $0 | $0 |
| 2017 | $274 | $90,949 | $0 | $0 |
| 2016 | $256 | $117,706 | $4,410 | $113,296 |
| 2015 | $247 | $98,896 | $4,120 | $94,776 |
| 2014 | $226 | $84,296 | $3,000 | $81,296 |
| 2013 | -- | $72,405 | $3,200 | $69,205 |
Source: Public Records
Map
Nearby Homes
- 1615 Fifth Ave
- 1111 Fifth Ave
- 1117 Fifth Ave
- 1216 Fifth Ave
- 1413 Fifth Ave
- 303 E 15th St
- 1421 Richmond Ave N
- 302 E 15th St
- 1503 Calvin Ave
- 1417 5th Ave
- 1511 Calvin Ave
- 1515 Lincoln Ave
- 1519 Calvin Ave
- 1420 Clayton Ave
- 1442 Lincoln Ave
- 1507 Clayton Ave
- 105 E 15th St
- 1400 Richmond Ave N
- 1518 Greenwood Ave Unit 3
- 1518 Greenwood Ave
- 1505 E 5th St
- 405 E 15th St
- 1510 Richmond Ave N
- 1509 Richmond Ave N
- 407 E 15th St
- 1512 Richmond Ave N
- 1423 5th Ave
- 1221 Fifth Ave
- 1219 Fifth Ave
- 809 Fifth Ave
- 1005 Fifth Ave Unit 15
- 914 Fifth Ave Unit 5
- 1309 Fifth Ave
- 1504 Fifth Ave
- 1604 Fifth Ave
- 1307 Fifth Ave
- 1402 Fifth Ave
- 1515 Fifth Ave
- 1609 Fifth Ave
- 914 Fifth Ave