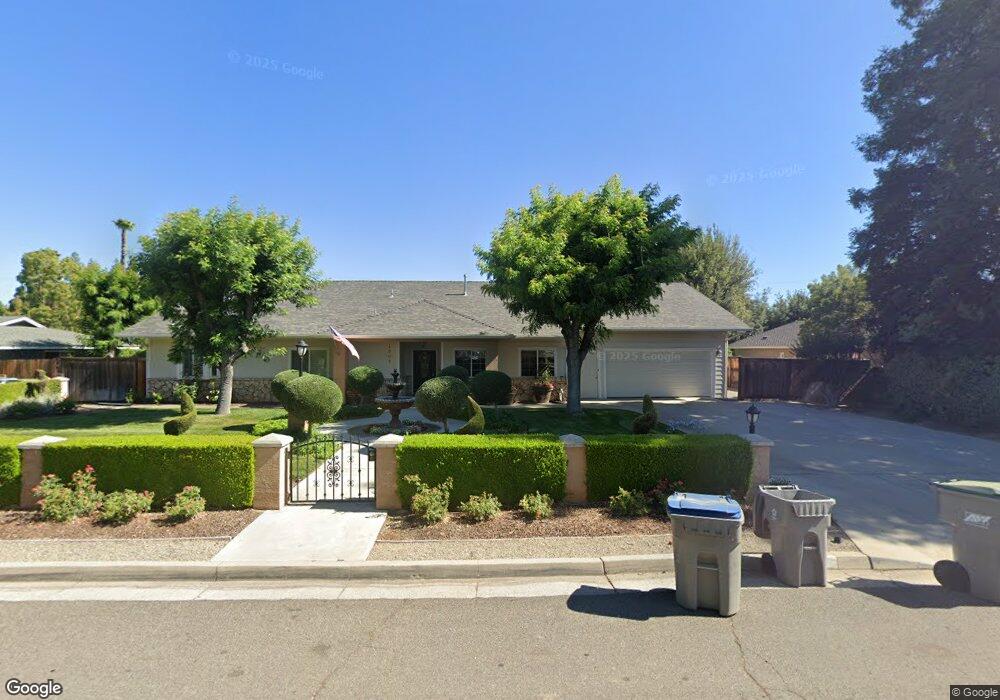
1504 W Scott Ave Fresno, CA 93711
Bullard NeighborhoodEstimated Value: $583,739 - $624,000
4
Beds
3
Baths
2,456
Sq Ft
$246/Sq Ft
Est. Value
About This Home
This home is located at 1504 W Scott Ave, Fresno, CA 93711 and is currently estimated at $605,185, approximately $246 per square foot. 1504 W Scott Ave is a home located in Fresno County with nearby schools including Gibson Elementary School, Tenaya Middle School, and Bullard High School.
Ownership History
Date
Name
Owned For
Owner Type
Purchase Details
Closed on
Jul 18, 2018
Sold by
Carrera Michael A and Carrera Elizabeth E
Bought by
Carrera Michael Anthony and Carrera Elizabeth Ellen
Current Estimated Value
Purchase Details
Closed on
Sep 11, 2013
Sold by
Carrera Michael A and Carrera Elizabeth E
Bought by
Carrera Michael A and Carrera Elizabeth E
Home Financials for this Owner
Home Financials are based on the most recent Mortgage that was taken out on this home.
Original Mortgage
$276,650
Outstanding Balance
$67,133
Interest Rate
3.4%
Mortgage Type
New Conventional
Estimated Equity
$538,052
Purchase Details
Closed on
May 5, 2004
Sold by
Lee Brian C and Lee Treva D
Bought by
Carrera Michael A and Carrera Elizabeth E
Home Financials for this Owner
Home Financials are based on the most recent Mortgage that was taken out on this home.
Original Mortgage
$333,700
Interest Rate
4.5%
Mortgage Type
Purchase Money Mortgage
Purchase Details
Closed on
Jan 10, 2003
Sold by
Machniak Mavis J
Bought by
Machniak Martin J and Machniak Mavis J
Create a Home Valuation Report for This Property
The Home Valuation Report is an in-depth analysis detailing your home's value as well as a comparison with similar homes in the area
Home Values in the Area
Average Home Value in this Area
Purchase History
| Date | Buyer | Sale Price | Title Company |
|---|---|---|---|
| Carrera Michael Anthony | -- | None Available | |
| Carrera Michael A | -- | Chicago Title Company | |
| Carrera Michael A | $300,000 | First American Title Ins Co | |
| Machniak Martin J | -- | -- |
Source: Public Records
Mortgage History
| Date | Status | Borrower | Loan Amount |
|---|---|---|---|
| Open | Carrera Michael A | $276,650 | |
| Previous Owner | Carrera Michael A | $333,700 | |
| Closed | Carrera Michael A | $55,982 |
Source: Public Records
Tax History Compared to Growth
Tax History
| Year | Tax Paid | Tax Assessment Tax Assessment Total Assessment is a certain percentage of the fair market value that is determined by local assessors to be the total taxable value of land and additions on the property. | Land | Improvement |
|---|---|---|---|---|
| 2025 | $4,525 | $418,155 | $79,444 | $338,711 |
| 2023 | $4,469 | $366,800 | $69,500 | $297,300 |
| 2022 | $4,364 | $356,200 | $67,500 | $288,700 |
| 2021 | $3,691 | $304,500 | $57,700 | $246,800 |
| 2020 | $3,371 | $276,900 | $52,500 | $224,400 |
| 2019 | $3,161 | $265,100 | $50,300 | $214,800 |
| 2018 | $3,061 | $257,500 | $48,900 | $208,600 |
| 2017 | $2,892 | $243,000 | $46,200 | $196,800 |
| 2016 | $2,756 | $235,030 | $44,671 | $190,359 |
| 2015 | $2,713 | $231,500 | $44,000 | $187,500 |
| 2014 | $2,536 | $216,800 | $41,200 | $175,600 |
Source: Public Records
Map
Nearby Homes
- 1473 W Scott Ave
- 1582 W San Jose Ave
- 5180 N Channing Way
- 4939 N Fruit Ave
- 5386 N Fruit Ave
- 5124 N Via Trevi
- 1685 W Robinwood Ln
- 1110 W Fairmont Ave
- 1720 W Barstow Ave
- 709 W Alamos Ave
- 2044 W San Bruno Ave
- 1647 W Wrenwood Ave
- 5125 N Via Amore
- 5072 N Forkner Ave
- 2059 W Barstow Ave
- 4895 N Thorne Ave
- 5088 N Forkner Ave
- 1159 W San Madele Ave
- 2190 W Via Cipressi
- 4837 N Ila Ave
- 1526 W Scott Ave
- 1486 W Scott Ave
- 1509 W San Jose Ave
- 0 Tbd 417-191-24 Unit 592318
- 1539 W San Jose Ave
- 1505 W Scott Ave
- 1485 W San Jose Ave
- 1544 W Scott Ave
- 1521 W Scott Ave
- 1493 W Scott Ave
- 1476 W Scott Ave
- 1541 W San Jose Ave
- 1543 W Scott Ave
- 1467 W San Jose Ave
- 1556 W Scott Ave
- 1512 W San Jose Ave
- 1508 W Keats Ave
- 1524 W Keats Ave
- 1555 W San Jose Ave
- 1494 W San Jose Ave