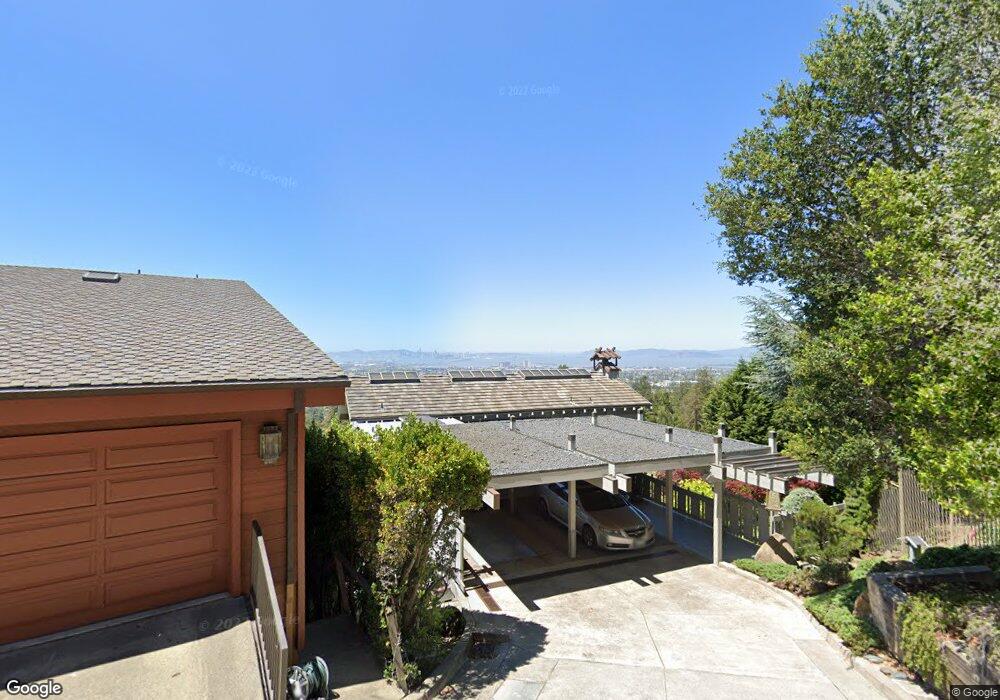
1504 Westview Dr Berkeley, CA 94705
Hiller Highlands NeighborhoodEstimated Value: $1,990,000 - $2,490,000
2
Beds
3
Baths
2,653
Sq Ft
$844/Sq Ft
Est. Value
About This Home
This home is located at 1504 Westview Dr, Berkeley, CA 94705 and is currently estimated at $2,237,820, approximately $843 per square foot. 1504 Westview Dr is a home located in Alameda County with nearby schools including Chabot Elementary School, Thornhill Elementary School, and Claremont Middle School.
Ownership History
Date
Name
Owned For
Owner Type
Purchase Details
Closed on
Sep 1, 2017
Sold by
Silva Edward M and Mcmurray Silva Family Trust
Bought by
Silva Edward M and Mcmurrau Silva Family Trust
Current Estimated Value
Purchase Details
Closed on
Sep 27, 2013
Sold by
Mcmurray James H and Silva Edward M
Bought by
Mcmurray James H and Silva Edward M
Purchase Details
Closed on
Aug 13, 1998
Sold by
Mcmurray James H
Bought by
Revocabl Mcmurray James H and Revocabl James H Mcmurray 1997
Create a Home Valuation Report for This Property
The Home Valuation Report is an in-depth analysis detailing your home's value as well as a comparison with similar homes in the area
Home Values in the Area
Average Home Value in this Area
Purchase History
| Date | Buyer | Sale Price | Title Company |
|---|---|---|---|
| Silva Edward M | -- | None Available | |
| Mcmurray James H | -- | None Available | |
| Mcmurray James H | -- | None Available | |
| Mcmurray James H | -- | None Available | |
| Revocabl Mcmurray James H | -- | -- |
Source: Public Records
Tax History
| Year | Tax Paid | Tax Assessment Tax Assessment Total Assessment is a certain percentage of the fair market value that is determined by local assessors to be the total taxable value of land and additions on the property. | Land | Improvement |
|---|---|---|---|---|
| 2025 | $4,924 | $242,475 | $47,807 | $201,668 |
| 2024 | $4,924 | $237,584 | $46,870 | $197,714 |
| 2023 | $5,067 | $239,789 | $45,951 | $193,838 |
| 2022 | $4,878 | $228,087 | $45,050 | $190,037 |
| 2021 | $4,553 | $223,477 | $44,166 | $186,311 |
| 2020 | $4,499 | $228,115 | $43,714 | $184,401 |
| 2019 | $4,260 | $223,642 | $42,857 | $180,785 |
| 2018 | $4,170 | $219,258 | $42,017 | $177,241 |
| 2017 | $3,983 | $214,960 | $41,193 | $173,767 |
| 2016 | $3,784 | $210,745 | $40,385 | $170,360 |
| 2015 | $3,758 | $207,580 | $39,778 | $167,802 |
| 2014 | $3,670 | $203,514 | $38,999 | $164,515 |
Source: Public Records
Map
Nearby Homes
- 45 Vicente Rd
- 0 Tunnel Rd
- 150 Vicente Rd
- 1426 Grand View Dr
- 260 Alvarado Rd
- 1488 Alvarado Rd
- 29 Live Oak Rd
- 142 Gravatt Dr
- 1102 Grand View Dr
- 641 Alvarado Rd
- 11 Hawks Hill Ct
- 204 El Camino Real
- 1881 Grand View Dr
- 0 Gravatt Dr Unit 41122154
- 2 Gravatt Dr
- 5668 Buena Vista Ave
- 0 Dartmouth Dr
- 7041 Devon Way
- 1215 Alvarado Rd
- 6839 Sherwick Dr
Your Personal Tour Guide
Ask me questions while you tour the home.