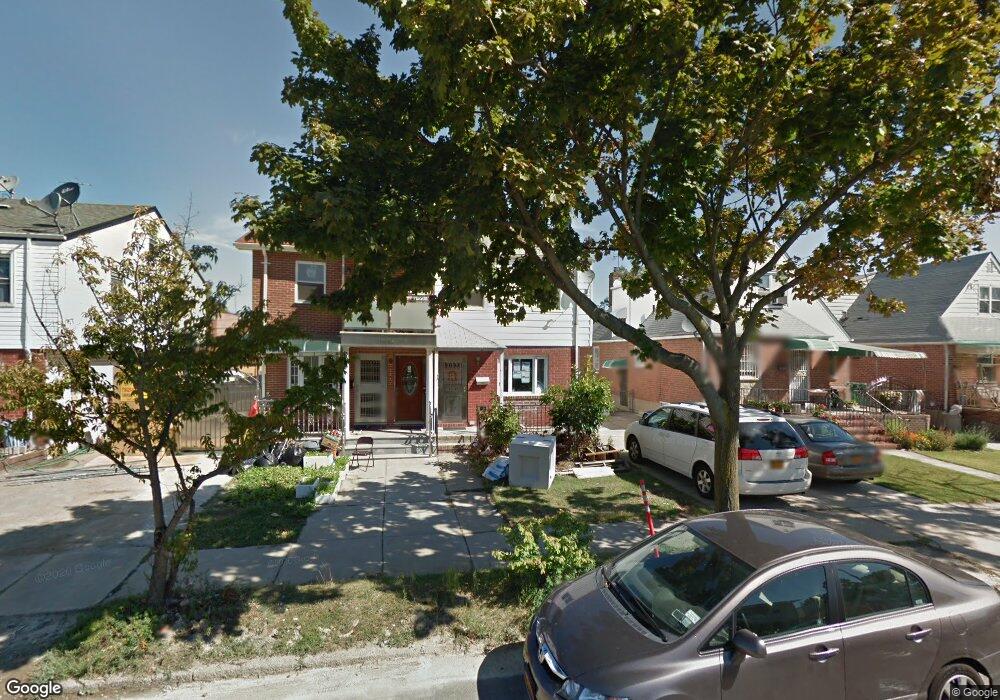
15041 59th Ave Unit 1 Fl Flushing, NY 11355
Queensboro Hill NeighborhoodEstimated Value: $1,170,000 - $1,523,000
2
Beds
1
Bath
1,853
Sq Ft
$720/Sq Ft
Est. Value
About This Home
This home is located at 15041 59th Ave Unit 1 Fl, Flushing, NY 11355 and is currently estimated at $1,333,345, approximately $719 per square foot. 15041 59th Ave Unit 1 Fl is a home located in Queens County with nearby schools including P.S. 163 - Flushing Heights, Rachel Carson I.S. 237Q, and John Bowne High School.
Ownership History
Date
Name
Owned For
Owner Type
Purchase Details
Closed on
Nov 8, 2011
Sold by
Jia Liu Ou Deceased
Bought by
Ou Meina Yuan and Ou Simon Cheng
Current Estimated Value
Home Financials for this Owner
Home Financials are based on the most recent Mortgage that was taken out on this home.
Original Mortgage
$210,000
Outstanding Balance
$143,683
Interest Rate
4.09%
Mortgage Type
Purchase Money Mortgage
Estimated Equity
$1,189,662
Purchase Details
Closed on
Jan 5, 2000
Sold by
Seto Jean
Bought by
Ou Simon C and Ou Jia Liu
Home Financials for this Owner
Home Financials are based on the most recent Mortgage that was taken out on this home.
Original Mortgage
$150,000
Interest Rate
7.91%
Purchase Details
Closed on
Feb 6, 1997
Sold by
Zeller Charles J and Zeller Marion
Bought by
Seto Jean
Create a Home Valuation Report for This Property
The Home Valuation Report is an in-depth analysis detailing your home's value as well as a comparison with similar homes in the area
Home Values in the Area
Average Home Value in this Area
Purchase History
| Date | Buyer | Sale Price | Title Company |
|---|---|---|---|
| Ou Meina Yuan | -- | -- | |
| Ou Simon C | $249,000 | -- | |
| Seto Jean | $159,000 | The Title Guarantee Company |
Source: Public Records
Mortgage History
| Date | Status | Borrower | Loan Amount |
|---|---|---|---|
| Open | Ou Meina Yuan | $210,000 | |
| Previous Owner | Ou Simon C | $150,000 |
Source: Public Records
Tax History
| Year | Tax Paid | Tax Assessment Tax Assessment Total Assessment is a certain percentage of the fair market value that is determined by local assessors to be the total taxable value of land and additions on the property. | Land | Improvement |
|---|---|---|---|---|
| 2025 | $9,517 | $49,374 | $9,127 | $40,247 |
| 2024 | $9,517 | $47,383 | $8,229 | $39,154 |
| 2023 | $9,167 | $45,641 | $8,714 | $36,927 |
| 2022 | $9,107 | $77,100 | $14,640 | $62,460 |
| 2021 | $9,057 | $70,020 | $14,640 | $55,380 |
| 2020 | $8,709 | $72,180 | $14,640 | $57,540 |
| 2019 | $8,260 | $71,040 | $14,640 | $56,400 |
| 2018 | $7,753 | $38,034 | $9,567 | $28,467 |
| 2017 | $7,753 | $38,034 | $11,304 | $26,730 |
| 2016 | $5,565 | $38,034 | $11,304 | $26,730 |
| 2015 | $3,012 | $26,265 | $11,668 | $14,597 |
| 2014 | $3,012 | $24,883 | $11,935 | $12,948 |
Source: Public Records
Map
Nearby Homes
- 58-33 150th St
- 14849 58th Rd
- 150-12 59th Ave
- 150-40 60th Ave
- 14839 60th Ave
- 150-01 Horace Harding Expy
- 148-10 59th Ave
- 59-09 Kissena Blvd
- 54-26 152nd St
- 153-51 Horace Harding Expy
- 148-03 Horace Harding Expy
- 54-29 153rd St
- 150-21 61st Rd
- 54-23 153rd St
- 146-18 59th Ave
- 152-12 Peck Ave
- 152-10 Peck Ave
- 6152 149th St
- 14234 Booth Memorial Ave
- 140-19 Rose Ave
- 15041 59th Ave
- 15041 59th Ave
- 15039 59th Ave
- 15039 59th Ave
- 15045 59th Ave
- 15037 59th Ave
- 15035 59th Ave
- 15047 59th Ave
- 15031 59th Ave
- 15051 59th Ave Unit 1
- 15051 59th Ave Unit 2Fl
- 15051 59th Ave
- 15051 59th Ave Unit A
- 15051 59th Ave Unit 1
- 15051 59th Ave Unit 2Fl
- 15051 59th Ave
- 15051 59th Ave
- 15048 58th Rd
- 15046 58th Rd
- 15044 58th Rd
Your Personal Tour Guide
Ask me questions while you tour the home.