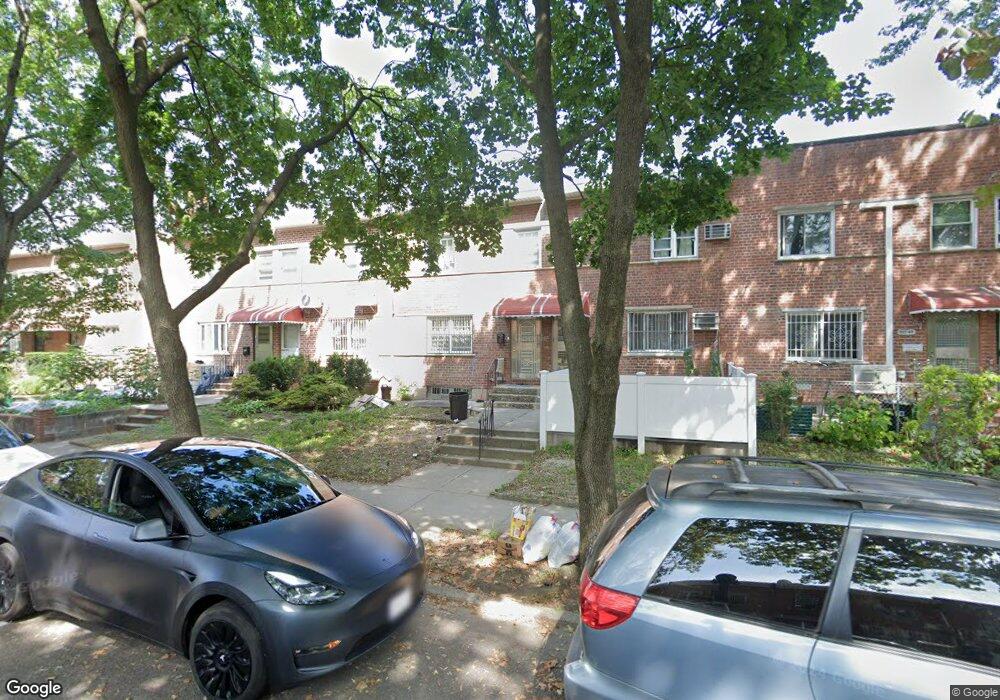
15043 58th Rd Flushing, NY 11355
Queensboro Hill NeighborhoodEstimated Value: $933,000 - $1,086,764
4
Beds
4
Baths
1,224
Sq Ft
$839/Sq Ft
Est. Value
About This Home
This home is located at 15043 58th Rd, Flushing, NY 11355 and is currently estimated at $1,026,941, approximately $839 per square foot. 15043 58th Rd is a home located in Queens County with nearby schools including P.S. 163 - Flushing Heights, Rachel Carson I.S. 237Q, and John Bowne High School.
Ownership History
Date
Name
Owned For
Owner Type
Purchase Details
Closed on
Oct 29, 2019
Sold by
Zheng Ai Jin
Bought by
You Jing Lai and Zheng Ai Jin
Current Estimated Value
Home Financials for this Owner
Home Financials are based on the most recent Mortgage that was taken out on this home.
Original Mortgage
$1,878
Outstanding Balance
$1,645
Interest Rate
3.6%
Mortgage Type
New Conventional
Estimated Equity
$1,025,296
Purchase Details
Closed on
Jun 22, 2017
Sold by
Huang Guang Feng and Zheng Ke Quan
Bought by
Zheng Ai Jin
Home Financials for this Owner
Home Financials are based on the most recent Mortgage that was taken out on this home.
Original Mortgage
$444,000
Interest Rate
3.95%
Mortgage Type
New Conventional
Purchase Details
Closed on
Feb 12, 2015
Sold by
Hrycak Joanne and Zibrick Joseph
Bought by
Huang Guang Feng and Zheng Ke Quan
Purchase Details
Closed on
May 14, 1996
Sold by
Zibrick Joseph and Zibrick Alice
Bought by
Zibrick Alice
Create a Home Valuation Report for This Property
The Home Valuation Report is an in-depth analysis detailing your home's value as well as a comparison with similar homes in the area
Home Values in the Area
Average Home Value in this Area
Purchase History
| Date | Buyer | Sale Price | Title Company |
|---|---|---|---|
| You Jing Lai | -- | -- | |
| You Jing Lai | -- | -- | |
| You Jing Lai | -- | -- | |
| Zheng Ai Jin | $888,000 | -- | |
| Zheng Ai Jin | $888,000 | -- | |
| Huang Guang Feng | $588,000 | -- | |
| Huang Guang Feng | $588,000 | -- | |
| Huang Guang Feng | $588,000 | -- | |
| Zibrick Alice | -- | First American Title Ins Co | |
| Zibrick Alice | -- | First American Title Ins Co |
Source: Public Records
Mortgage History
| Date | Status | Borrower | Loan Amount |
|---|---|---|---|
| Open | You Jing Lai | $1,878 | |
| Closed | You Jing Lai | $1,878 | |
| Previous Owner | Zheng Ai Jin | $444,000 |
Source: Public Records
Tax History
| Year | Tax Paid | Tax Assessment Tax Assessment Total Assessment is a certain percentage of the fair market value that is determined by local assessors to be the total taxable value of land and additions on the property. | Land | Improvement |
|---|---|---|---|---|
| 2025 | $7,197 | $35,832 | $5,442 | $30,390 |
| 2024 | $7,197 | $35,831 | $6,295 | $29,536 |
| 2023 | $7,142 | $35,557 | $5,592 | $29,965 |
| 2022 | $6,697 | $55,980 | $9,540 | $46,440 |
| 2021 | $6,661 | $54,540 | $9,540 | $45,000 |
| 2020 | $6,320 | $53,220 | $9,540 | $43,680 |
| 2019 | $6,246 | $53,280 | $9,540 | $43,740 |
| 2018 | $5,699 | $29,631 | $6,002 | $23,629 |
| 2017 | $5,699 | $27,955 | $6,039 | $21,916 |
| 2016 | $5,272 | $27,955 | $6,039 | $21,916 |
| 2015 | $2,788 | $24,883 | $7,700 | $17,183 |
Source: Public Records
Map
Nearby Homes
- 58-33 150th St
- 14849 58th Rd
- 150-12 59th Ave
- 150-40 60th Ave
- 14839 60th Ave
- 150-01 Horace Harding Expy
- 148-10 59th Ave
- 59-09 Kissena Blvd
- 54-26 152nd St
- 153-51 Horace Harding Expy
- 148-03 Horace Harding Expy
- 54-29 153rd St
- 150-21 61st Rd
- 54-23 153rd St
- 146-18 59th Ave
- 152-12 Peck Ave
- 152-10 Peck Ave
- 6152 149th St
- 14234 Booth Memorial Ave
- 140-19 Rose Ave
Your Personal Tour Guide
Ask me questions while you tour the home.