15047 Xenia St Thornton, CO 80602
Heritage Todd Creek NeighborhoodEstimated Value: $539,691 - $606,000
2
Beds
2
Baths
2,317
Sq Ft
$249/Sq Ft
Est. Value
About This Home
This home is located at 15047 Xenia St, Thornton, CO 80602 and is currently estimated at $577,673, approximately $249 per square foot. 15047 Xenia St is a home located in Adams County with nearby schools including Brantner Elementary School, Elderberry Elementary, and Ray Wiltsey Middle School.
Ownership History
Date
Name
Owned For
Owner Type
Purchase Details
Closed on
Sep 24, 2021
Sold by
Cordrey Lee and Cordrey Nora
Bought by
Chatting Thomas John and Chatting Pamela Anne
Current Estimated Value
Purchase Details
Closed on
Sep 6, 2013
Sold by
Valentine Monika L and Valentine Jeffery T
Bought by
Cordrey Lee and Cordrey Nora
Home Financials for this Owner
Home Financials are based on the most recent Mortgage that was taken out on this home.
Original Mortgage
$246,000
Interest Rate
3.37%
Mortgage Type
Adjustable Rate Mortgage/ARM
Purchase Details
Closed on
Dec 21, 2011
Sold by
Lennar Colorado Llc
Bought by
Valentine Jeffery T and Valentine Monika L
Home Financials for this Owner
Home Financials are based on the most recent Mortgage that was taken out on this home.
Original Mortgage
$242,100
Interest Rate
4.03%
Mortgage Type
New Conventional
Create a Home Valuation Report for This Property
The Home Valuation Report is an in-depth analysis detailing your home's value as well as a comparison with similar homes in the area
Home Values in the Area
Average Home Value in this Area
Purchase History
| Date | Buyer | Sale Price | Title Company |
|---|---|---|---|
| Chatting Thomas John | $530,000 | Guardian Title | |
| Cordrey Lee | $307,500 | North Amer Title Co Of Co | |
| Valentine Jeffery T | $269,000 | North American Title |
Source: Public Records
Mortgage History
| Date | Status | Borrower | Loan Amount |
|---|---|---|---|
| Previous Owner | Cordrey Lee | $246,000 | |
| Previous Owner | Valentine Jeffery T | $242,100 |
Source: Public Records
Tax History Compared to Growth
Tax History
| Year | Tax Paid | Tax Assessment Tax Assessment Total Assessment is a certain percentage of the fair market value that is determined by local assessors to be the total taxable value of land and additions on the property. | Land | Improvement |
|---|---|---|---|---|
| 2024 | $4,790 | $37,070 | $8,270 | $28,800 |
| 2023 | $4,774 | $36,730 | $7,780 | $28,950 |
| 2022 | $5,062 | $30,790 | $7,990 | $22,800 |
| 2021 | $4,969 | $30,790 | $7,990 | $22,800 |
| 2020 | $4,949 | $31,820 | $8,220 | $23,600 |
| 2019 | $4,940 | $31,820 | $8,220 | $23,600 |
| 2018 | $4,303 | $27,590 | $6,210 | $21,380 |
| 2017 | $4,290 | $27,590 | $6,210 | $21,380 |
| 2016 | $3,660 | $24,100 | $5,680 | $18,420 |
| 2015 | $3,655 | $25,990 | $5,680 | $20,310 |
| 2014 | $3,151 | $20,430 | $3,390 | $17,040 |
Source: Public Records
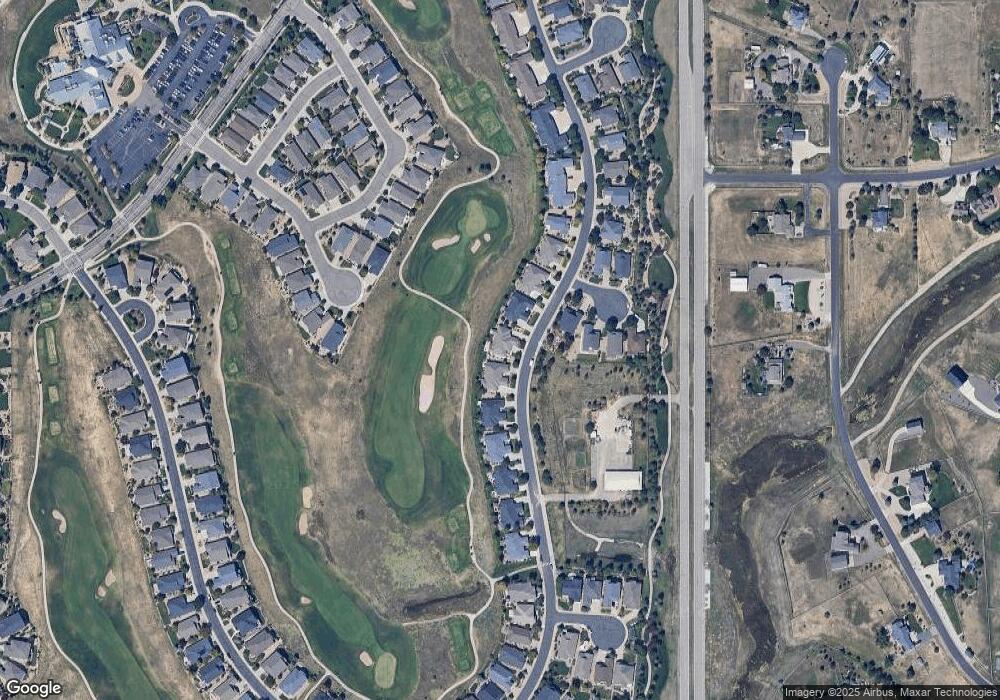
Map
Nearby Homes
- 15122 Wabash Place
- 8724 E 148th Cir
- 8624 E 148th Cir
- 10512 E 152nd Ave
- 8700 Ehler Pkwy
- 14700 Akron St
- 9153 E 155th Dr
- 9407 E 147th Place
- 7830 E 148th Dr
- 15750 Willow Way
- 15211 Quince St
- 9880 E 155th Place
- 15619 Syracuse Way
- 15879 Willow St
- 15859 Xanthia Way
- 9742 E 146th Ave
- 7160 E 152nd Ave
- 15342 Poplar St
- 15348 Poplar St
- 7130 E 152nd Ave
- 15045 Xenia St
- 15049 Xenia St
- 15043 Xenia St
- 15029 Xenia St
- 15063 Xenia St
- 15065 Xenia St
- 15027 Xenia St
- 15067 Xenia St
- 15025 Xenia St
- 8820 E 151st Ct
- 15069 Xenia St
- 15023 Xenia St
- 15073 Xenia St
- 8836 E 151st Ct
- 14967 Xenia St
- 15075 Xenia St
- 8827 E 151st Ct
- 14963 Xenia St
- 8854 E 151st Ct
- 15077 Xenia St