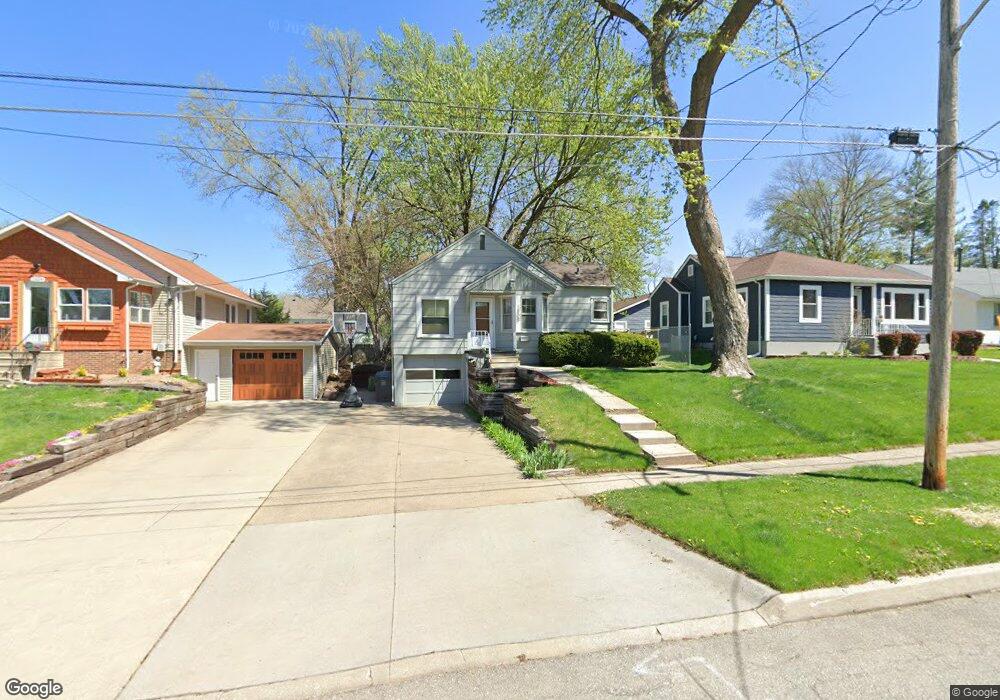
1505 56th St Des Moines, IA 50311
Merle Hay NeighborhoodEstimated Value: $179,543 - $201,000
2
Beds
1
Bath
737
Sq Ft
$259/Sq Ft
Est. Value
About This Home
This home is located at 1505 56th St, Des Moines, IA 50311 and is currently estimated at $190,886, approximately $259 per square foot. 1505 56th St is a home located in Polk County with nearby schools including Windsor Elementary School, Merrill Middle School, and Roosevelt High School.
Ownership History
Date
Name
Owned For
Owner Type
Purchase Details
Closed on
Mar 19, 2000
Sold by
Herselius Amy and Herselius Amy L
Bought by
Zingerman Richard
Current Estimated Value
Purchase Details
Closed on
Dec 14, 1998
Sold by
Abbas Cory D and Reis Emily G
Bought by
Herseluis Amy
Home Financials for this Owner
Home Financials are based on the most recent Mortgage that was taken out on this home.
Original Mortgage
$76,460
Interest Rate
6.96%
Mortgage Type
FHA
Purchase Details
Closed on
Apr 28, 1997
Sold by
Brock James D and Brock Kandra D
Bought by
Abbas Cory D and Reis Emily G
Home Financials for this Owner
Home Financials are based on the most recent Mortgage that was taken out on this home.
Original Mortgage
$72,462
Interest Rate
8.05%
Mortgage Type
FHA
Create a Home Valuation Report for This Property
The Home Valuation Report is an in-depth analysis detailing your home's value as well as a comparison with similar homes in the area
Home Values in the Area
Average Home Value in this Area
Purchase History
| Date | Buyer | Sale Price | Title Company |
|---|---|---|---|
| Zingerman Richard | $80,000 | -- | |
| Herseluis Amy | $76,000 | -- | |
| Abbas Cory D | $72,000 | -- |
Source: Public Records
Mortgage History
| Date | Status | Borrower | Loan Amount |
|---|---|---|---|
| Previous Owner | Herseluis Amy | $76,460 | |
| Previous Owner | Abbas Cory D | $72,462 |
Source: Public Records
Tax History Compared to Growth
Tax History
| Year | Tax Paid | Tax Assessment Tax Assessment Total Assessment is a certain percentage of the fair market value that is determined by local assessors to be the total taxable value of land and additions on the property. | Land | Improvement |
|---|---|---|---|---|
| 2025 | $2,732 | $167,100 | $40,700 | $126,400 |
| 2024 | $2,732 | $149,300 | $35,800 | $113,500 |
| 2023 | $2,924 | $149,300 | $35,800 | $113,500 |
| 2022 | $2,898 | $132,900 | $32,300 | $100,600 |
| 2021 | $2,758 | $132,900 | $32,300 | $100,600 |
| 2020 | $2,860 | $119,100 | $28,800 | $90,300 |
| 2019 | $2,604 | $119,100 | $28,800 | $90,300 |
| 2018 | $2,572 | $105,400 | $25,100 | $80,300 |
| 2017 | $2,310 | $105,400 | $25,100 | $80,300 |
| 2016 | $2,244 | $93,900 | $21,900 | $72,000 |
| 2015 | $2,244 | $93,900 | $21,900 | $72,000 |
| 2014 | $2,166 | $90,200 | $20,700 | $69,500 |
Source: Public Records
Map
Nearby Homes