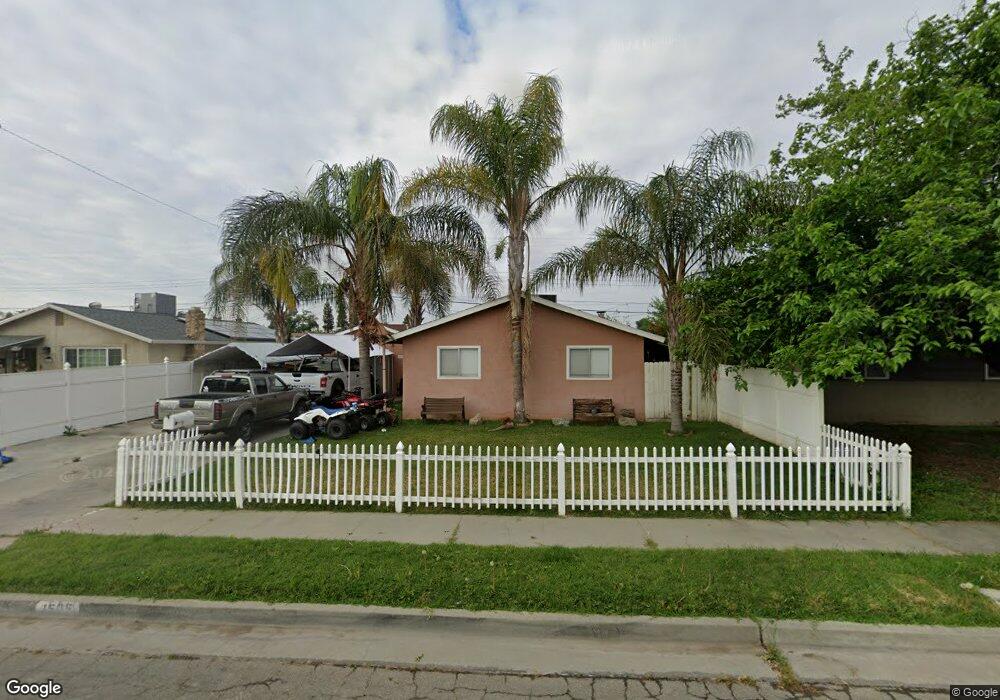
1505 Hayden Ave Hanford, CA 93230
Estimated Value: $268,000 - $298,000
3
Beds
2
Baths
1,120
Sq Ft
$252/Sq Ft
Est. Value
About This Home
This home is located at 1505 Hayden Ave, Hanford, CA 93230 and is currently estimated at $282,064, approximately $251 per square foot. 1505 Hayden Ave is a home located in Kings County with nearby schools including Roosevelt Elementary School, Woodrow Wilson Junior High School, and Hanford West High School.
Ownership History
Date
Name
Owned For
Owner Type
Purchase Details
Closed on
Dec 17, 2010
Sold by
The Bank Of New York Mellon
Bought by
Velazquez Arturo
Current Estimated Value
Purchase Details
Closed on
May 6, 2010
Sold by
Dugger Jason and Dugger Kirstyn
Bought by
The Bank Of New York Mellon and The Bank Of New York
Purchase Details
Closed on
Jun 19, 2006
Sold by
Dugger Jason and Dugger Kirstyn
Bought by
Dugger Jason and Dugger Kirstyn
Home Financials for this Owner
Home Financials are based on the most recent Mortgage that was taken out on this home.
Original Mortgage
$166,500
Interest Rate
7.87%
Mortgage Type
New Conventional
Purchase Details
Closed on
Feb 22, 2005
Sold by
Silva Joe C and Silva Bonnie J
Bought by
Dugger Jason and Dugger Kirsten
Home Financials for this Owner
Home Financials are based on the most recent Mortgage that was taken out on this home.
Original Mortgage
$102,900
Interest Rate
7.62%
Mortgage Type
Purchase Money Mortgage
Create a Home Valuation Report for This Property
The Home Valuation Report is an in-depth analysis detailing your home's value as well as a comparison with similar homes in the area
Home Values in the Area
Average Home Value in this Area
Purchase History
| Date | Buyer | Sale Price | Title Company |
|---|---|---|---|
| Velazquez Arturo | $52,500 | Pasion Title | |
| The Bank Of New York Mellon | $81,000 | First American Title Ins Co | |
| Dugger Jason | -- | None Available | |
| Dugger Jason | $147,000 | Chicago Title Company |
Source: Public Records
Mortgage History
| Date | Status | Borrower | Loan Amount |
|---|---|---|---|
| Previous Owner | Dugger Jason | $166,500 | |
| Previous Owner | Dugger Jason | $102,900 |
Source: Public Records
Tax History Compared to Growth
Tax History
| Year | Tax Paid | Tax Assessment Tax Assessment Total Assessment is a certain percentage of the fair market value that is determined by local assessors to be the total taxable value of land and additions on the property. | Land | Improvement |
|---|---|---|---|---|
| 2025 | $1,156 | $108,893 | $38,433 | $70,460 |
| 2023 | $1,156 | $104,667 | $36,942 | $67,725 |
| 2022 | $1,132 | $102,616 | $36,218 | $66,398 |
| 2021 | $1,107 | $100,605 | $35,508 | $65,097 |
| 2020 | $1,119 | $99,574 | $35,144 | $64,430 |
| 2019 | $1,100 | $97,622 | $34,455 | $63,167 |
| 2018 | $1,069 | $95,707 | $33,779 | $61,928 |
| 2017 | $1,053 | $93,831 | $33,117 | $60,714 |
| 2016 | $1,039 | $91,992 | $32,468 | $59,524 |
| 2015 | $934 | $82,000 | $40,000 | $42,000 |
| 2014 | $841 | $73,834 | $25,114 | $48,720 |
Source: Public Records
Map
Nearby Homes
- 1405 Arthur St
- 1526 W Bison Ln Unit Ae 86
- 1575 Bluejay Cir
- 1240 Washington St
- 735 Manor Ave
- 573 Manor Ave
- 1292 S Monterey Ave
- 1292 Monterey Ave
- 775 Kimball Ln
- 1765 Parkside Dr
- 1426 W Sidonia St
- 1638 Acres Way
- 670 Grant St
- 1754 W Twilight St
- Orchid Plan at Live Oak
- Marigold Plan at Live Oak
- Abernathy Plan at Live Oak
- 1452 S Polar Ave
- Beaumont Plan at Live Oak
- Clover Plan at Live Oak